Figures & data
Figure 1. Experimental procedures employed in the present study.
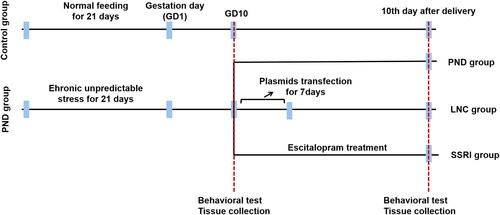
Figure 2. Construction of lncRNA NONHSAG045500 expression plasmid.
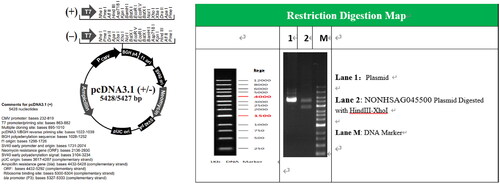
Figure 3. CUS-exposed mice exhibited depressive-like behaviors and lower expression of NONHSAG045500. (A) Sucrose preference test (n = 15 in each group). (B) Time spent in the central area (n = 15 in each group). (C) Total distances travelled (n = 15 in each group). (D) Time spent immobile test (n = 15 in each group). (E) NONHSAG045500 expression in peripheral blood (n = 5 in each group). Differences between the two groups were measured using Student’s t-test. **p < .01, ***p < .001.
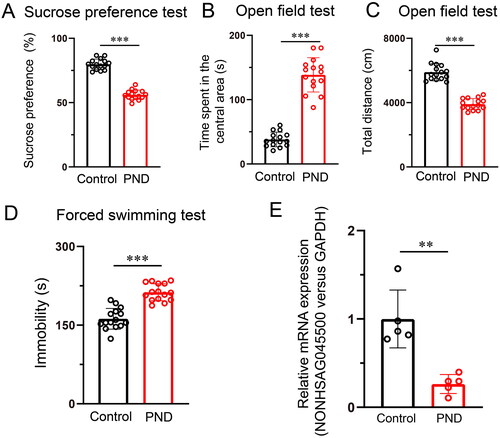
Figure 4. Effect of NONHSAG045500 overexpression on the perinatal depression mouse model. (A) NONHSAG045500 expression (n = 5 in each group). (B) Sucrose preference test (n = 15 in each group). (C) Time spent in the central area (n = 15 in each group). (D) Total distances traveled (n = 15 in each group). (E) Time spent immobile test (n = 15 in each group). (F) Body weight in each group (n = 15 in each group). Differences among the four groups were measured using one-way ANOVA and post hoc Student’s t-test. *p < .05, **p < .01, ***p < .001, ns, not significant.
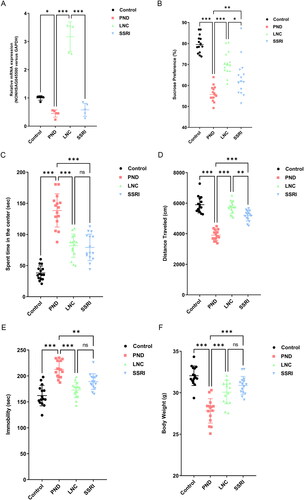
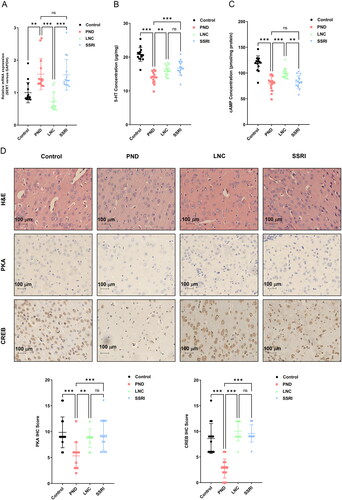
Figure 5. Overexpressed lncRNA NONHSAG045500 inhibited the expression of SERT and the activation of the cAMP–PKA–CREB signaling pathway in the perinatal mouse model. Levels of SERT (A), 5-HT (B), and cAMP (C) in each group (n = 15 in each group). (D)Hematoxylin–eosin staining and expression of PKA and CREB in each group. Bar, 100 μm (black). Differences among the four groups were measured using one-way ANOVA and post hoc Student’s t-test. *p < .05, ns, not significant.