
Figures & data
Figure 1. Flowchart of the study population. IUGR: intrauterine growth restriction; GDM: gestational diabetes mellitus; PGDM: pregestational diabetes mellitus; OGTT: oral glucose tolerance test.
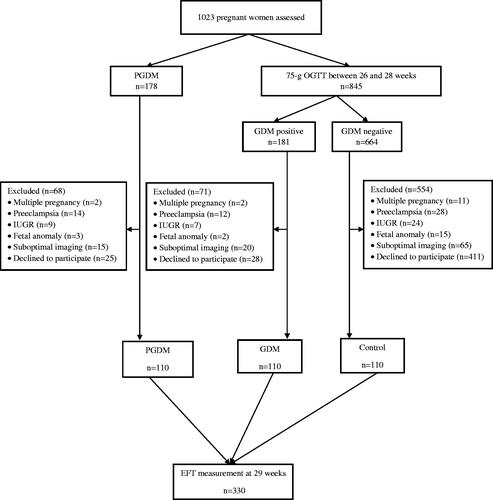
Figure 2. Ultrasonographic image of fetal epicardial fat tissue. EFT: epicardial fat thickness; RV: right ventricle; LV: left ventricle; IVS: interventricular septum; Ao: ascending aorta; LA: left atrium.
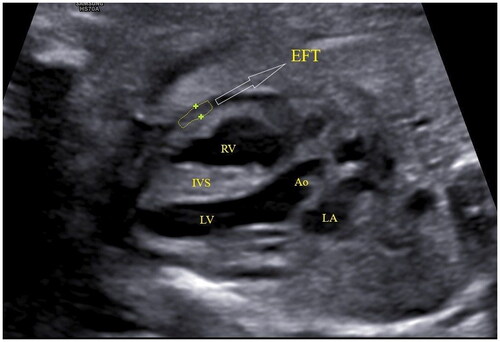
Table 1. Demographic features, laboratory and ultrasound findings of the three groups.
Figure 3. Distribution of EFT values of GDM, PGDM, and control groups (a). ROC curves constructed with the multivariate logistic regression model. The AUC of EFT with other variables (FPG, 1hPG, 2hPG, HbA1c, AC, and DVP) for the diagnosis of GDM (1.000) is larger than when using the individual factors of EFT (0.985), FPG (0.643), 1hPG (0.956), 2hPG (0.976), HbA1c (0.902), AC (0.696), and DVP (0.669) (b). The AUC of EFT with other variables (HbA1c, AC, and DVP) for the diagnosis of PGDM (1.000) is larger than when using the individual factors of EFT (0.999), HbA1c (0.934), AC (0.858), and DVP (0.814) (c). 1hPG: 1 h plasma glucose; 2hPG: 2 h plasma glucose; AC: abdominal circumference; DVP: deepest vertical pocket; EFT: epicardial fat thickness; FPG: fasting plasma glucose; GDM: gestational diabetes mellitus; PGDM: pregestational diabetes mellitus.
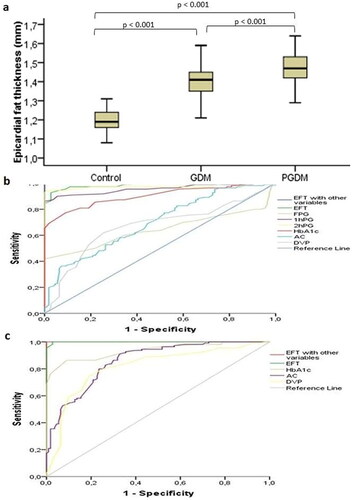
Table 2. Correlation analysis between epicardial fat thickness and demographic features, laboratory and ultrasound findings.