
Figures & data
Figure 1. Estimated global rate of the rates of preterm birth in 2014. (Courtesy of Chawanpaiboon et al. Lancet 2019) [Citation4].
![Figure 1. Estimated global rate of the rates of preterm birth in 2014. (Courtesy of Chawanpaiboon et al. Lancet 2019) [Citation4].](/cms/asset/6756d852-4847-49d2-9e00-d01c0e98b33b/ijmf_a_2183756_f0001_c.jpg)
Table 1. Effectiveness of interventions in primary prevention (data are presented as the OR changes with each factor).
Table 2. Accuracy of various biomarkers for the diagnosis of PTL.
Figure 2. Transvaginal ultrasound scan demonstrating an intra-amniotic sludge above the internal cervical os (A and B - sludge of different sizes).
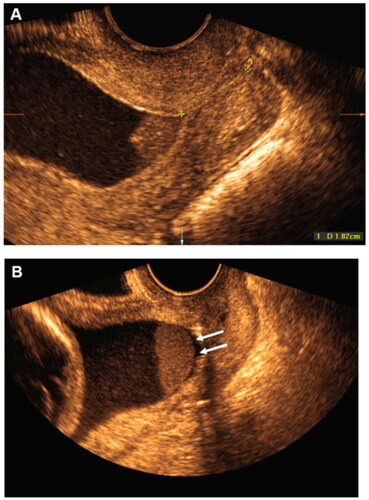
Figure 3. Placement of balloon to reduce membranes prior to cerclage insertion with Uniconcave catheter (Courtesy of Lv et al. 2000) [Citation77].
![Figure 3. Placement of balloon to reduce membranes prior to cerclage insertion with Uniconcave catheter (Courtesy of Lv et al. 2000) [Citation77].](/cms/asset/636a8e40-ff3e-459e-ad45-38e83eb0b4a8/ijmf_a_2183756_f0003_c.jpg)