Figures & data
Table 1. Characteristics of women enrolled.
Table 2. Pregnancy outcomes of the population enrolled.
Table 3. Association of hypertension and intrauterine growth restriction (IUGR) with demographic, biochemical, ultrasound, and hemodinamics parameter.
Table 4. Accuracy and predictive ability of potential risk factors for hypertension; point estimates are presented along with 95% confidence intervals.
Table 5. Accuracy and predictive ability of potential risk factors for intrauterine growth restriction (IUGR).
Table 6. Accuracy and predictive ability of potential risk factors for hypertension or intrauterine growth restriction (IUGR).
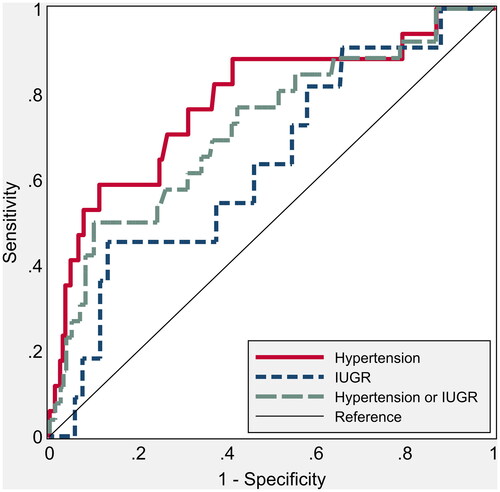
Figure 1. Nonparametric receiver operating characteristic (ROC) curves for umbilical artery pulsatility index (UTPI) to predict hypertension and intrauterine growth restriction. The areas under the ROC curve are shown in .
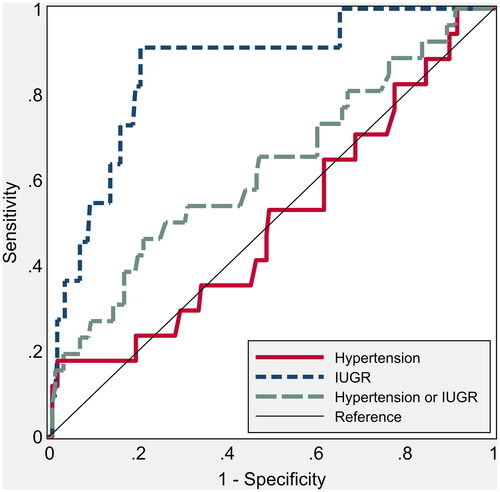
Figure 2. Nonparametric receiver operating characteristic (ROC) curves for cardiac output to predict hypertension and intrauterine growth restriction. The areas under the ROC curve are shown in .
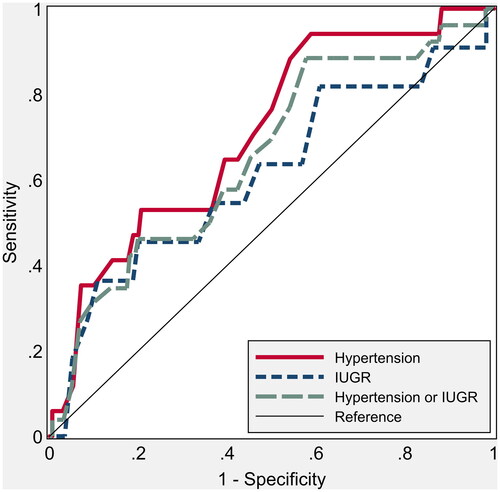
Figure 3. Nonparametric receiver operating characteristic (ROC) curves for total vascular resistance (TVR) to predict hypertension and intrauterine growth restriction. The areas under the ROC curve are shown in .