1,892
Views
0
CrossRef citations to date
0
Altmetric
Original Article

Low lying placenta: natural course, clinical data, complications and a new model for early prediction of persistency

, , , , , , & show all
Article: 2204998 | Received 14 Apr 2022, Accepted 15 Apr 2023, Published online: 26 Apr 2023

Figures & data

Table 1. Maternal characteristics.

Figure 1. The receiver operating characteristic curve for the interaction of the parameters (cervical length in the first trimester and second trimester hCG level) was statistically significant (area under the curve of 0.681, p = .006).

Figure 1. The receiver operating characteristic curve for the interaction of the parameters (cervical length in the first trimester and second trimester hCG level) was statistically significant (area under the curve of 0.681, p = .006).

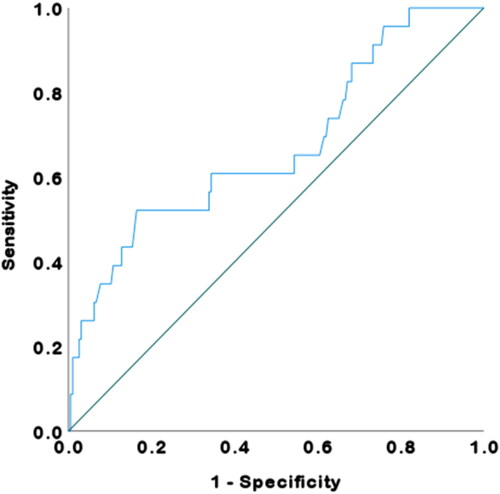
Table 2. Multivariate logistic regression analysis.

Table 3. Neonatal characteristics.

Figure 2. Visualization of the data: each point corresponds to a woman in Group 1 or 2 and is characterized by features a and b, where feature a is the cervical length at the first anatomical scan and feature b is the second trimester hCG level. Clear separation between Groups 1 + 2 and 3 is observed. A Linear Support Vector Machine (LSVM) classification using the MATLAB Classification Learner software was used. The LSVM is a classical machine learning approach widely used in supervised learning to find a line with the largest margin that separates different class data points. Since the available data sets were limited in size, validation of the model was performed using 5-fold cross-validation.

Figure 2. Visualization of the data: each point corresponds to a woman in Group 1 or 2 and is characterized by features a and b, where feature a is the cervical length at the first anatomical scan and feature b is the second trimester hCG level. Clear separation between Groups 1 + 2 and 3 is observed. A Linear Support Vector Machine (LSVM) classification using the MATLAB Classification Learner software was used. The LSVM is a classical machine learning approach widely used in supervised learning to find a line with the largest margin that separates different class data points. Since the available data sets were limited in size, validation of the model was performed using 5-fold cross-validation.

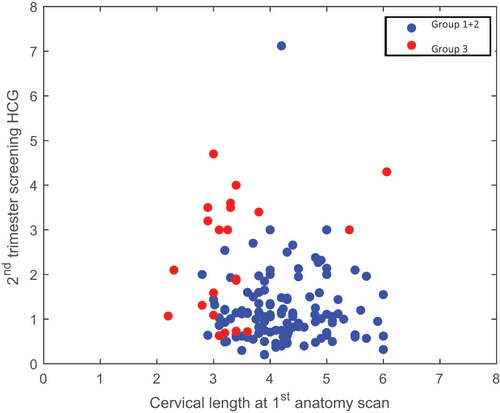
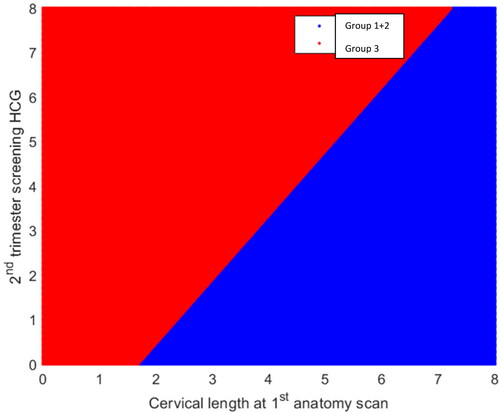
Figure 3. The visualization of the classification surfaces of the model is shown in . The prediction accuracy was found to be 90.3%.

Figure 3. The visualization of the classification surfaces of the model is shown in Figure 2. The prediction accuracy was found to be 90.3%.

Data availability statement

Data is available upon request.