Figures & data
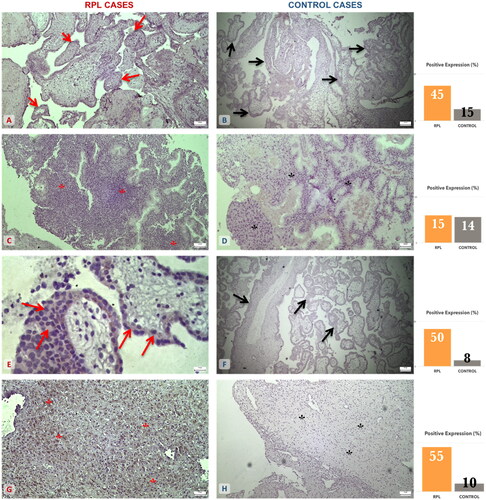
Figure 1. MMP-2 and MMP-9 expression on trophoblastic and decidual tissue specimens among the RPL and elective abortion (control) group. (A) Moderate expression of MMP-2 on RPL trophoblastic tissue (↑) (×10 magnification). (B) Moderate expression of MMP-2 on control trophoblastic tissue (↑) (×10 magnification). (C) Mild expression of MMP-2 on RPL decidual tissue (*) (×10 magnification). (D) Mild expression of MMP-2 on control decidual tissue (*) (×10 magnification). (E) Moderate expression of MMP-9 on RPL trophoblastic tissue (↑) (×10 magnification). (F) Negative expression of MMP-9 on control trophoblastic tissue (↑) (×10 magnification). (G) Moderate expression of MMP-9 on RPL decidual tissue (*) (×10 magnification). (H) Negative expression of MMP-9 on control decidual tissue (*) (×10 magnification). The graphs are an approximate percentage of staining for the specimens presented in this figure.
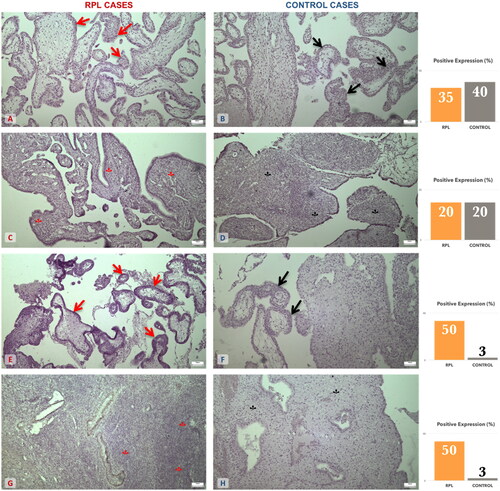
Table 1. MMP-2, MMP-9, EGFR and IL-8 intensities of staining on trophoblastic and decidual tissues. Comparisons among experimental (RPL) and control (electively abortion) groups.
Figure 2. EGFR and IL-8 expression on trophoblastic and decidual tissue specimens among the RPL and elective abortion (control) group. (A) Moderate expression of EGFR on RPL trophoblastic tissue (↑) (×10 magnification). (B) Mild expression of EGFR on control trophoblastic tissue (↑) (×4 magnification). (C) Mild expression of EGFR on RPL decidual tissue (*) (×4 magnification). (D) Mild expression of EGFR on control decidual tissue (*) (×10 magnification). (E) Moderate expression of IL-8 on RPL trophoblastic tissue (↑) (×40 magnification). (F) Mild expression of IL-8 on control trophoblastic tissue (↑) (×4 magnification). (G) Moderate to strong expression of IL-8 on RPL decidual tissue (*) (×10 magnification). (H) Mild expression of IL-8 on control decidual tissue (*) (×4 magnification). The graphs are an approximate percentage of staining for the specimens presented in this figure.