
Figures & data
Table 1. Primer sequence.
Figure 1. Embryonic development of the pregnant mice in each group (n = 10, scale: 1:1, a representative figure for each group was selected). A: Control group (normal pregnant mice + normal saline). B: RSA group (RSA model mice + normal saline). C: LMWH group (RSA model mice + LMWH).
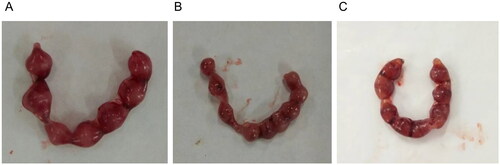
Table 2. Comparison of embryo resorption rate in pregnant mice among different groups.
Figure 2. Expression levels of IGFBP1and PRL mRNA in the decidual tissues of the mice in each group. A: Expression level of IGFBP1 mRNA in the decidual tissues of mice. B: Expression level of PRL mRNA in the decidual tissues of mice. All experiments were conducted independently in triplicate, and the data were presented as mean ± SEM (n = 9) (*p < 0.05, **p < 0.01, ***p < 0.001, #p > 0.05, not significant).
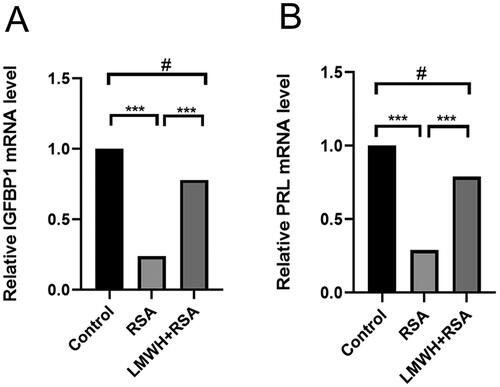
Figure 3. Decidual cell matrix of primary culture in early human pregnancy. A: Decidual stromal cells isolated under a light microscope. B: Identification of decidual stromal cells by immunofluorescence. The red fluorescent ones are metaphase interstitial cells.
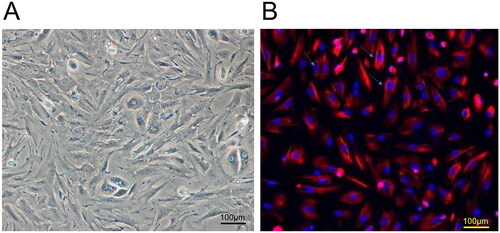
Figure 4. Comparison of decidual stromal cell proliferation between patients with RSA and pregnant women without RSA in early pregnancy. R: Patients with RSA. N: Pregnant women without RSA(healthy women in early pregnancy who required an induced abortion due to unwanted pregnancy).

Figure 5. Proliferation level of decidual stromal cells under the action of LMWH. All experiments were conducted independently in triplicate, and the data were presented as mean ± SEM (n = 6) (*p < 0.05, **p < 0.01, ***p < 0.001, #p > 0.05, not significant).
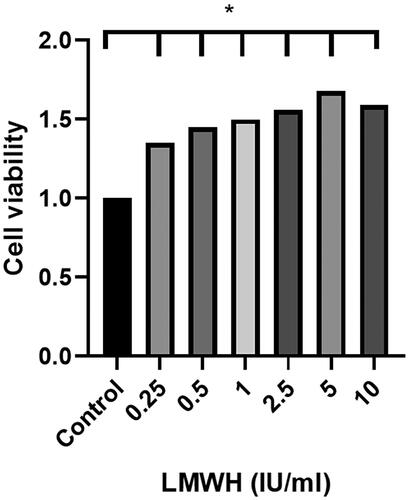
Figure 6. Effects of LMWH on the expression levels of cyclin D1 and PCNA in decidual stromal cells. A: Expression levels of cyclin D1 and PCNA proteins in the control group (0-IU/ml LMWH), 0.25-IU/ml LMWH and 5-IU/ml LMWH after cell co-culture. B: Cyclin D1 and PCNA protein expression. (The protein expression of MMP-2 and MMP-7 was quantified using GAPDH as a control). All experiments were conducted independently in triplicate, and the data were presented as mean ± SEM (n = 4) (*p < 0.05, **p < 0.01, ***p < 0.001, #p > 0.05, not significant).
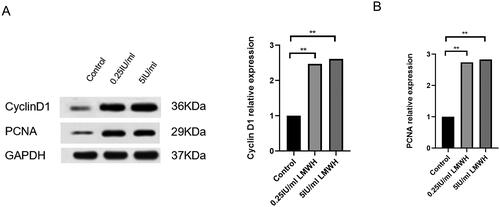
Figure 7. Scratch and Transwell assays for exploring the effects of LMWH on the migration and invasion of human decidual stromal cells. A: Scratch assay: The effect of LMWH on the migration of human decidual stromal cells at 0 and 48 h. Transwell assay: The effects of LMWH on the invasion of human decidual stromal cells. B: Quantification of scratch and Transwell results. All experiments were conducted independently in triplicate, and the data were presented as mean ± SEM (n = 3) (*p < 0.05, **p < 0.01, ***p < 0.001, #p > 0.05, not significant).
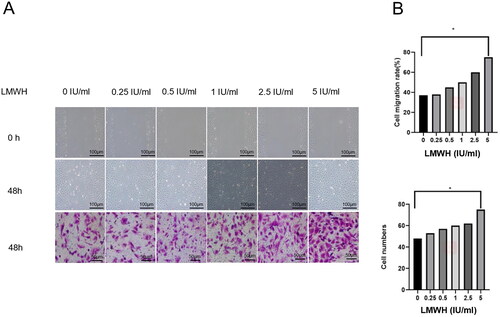
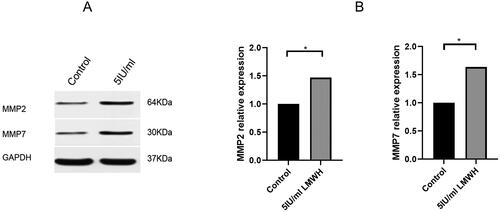
Figure 8. Effects of LMWH on the expression levels of MMP-2 and MMP-7 in decidual stromal cells. A: Expression levels of MMP-2 and MMP-7 proteins in the control group (0-UI/ml LMWH) and the experimental group (0.5-UI/ml LMWH) after co-culture. B: The protein expression of MMP-2 and MMP-7 was quantified using GAPDH as a control. All experiments were conducted independently in triplicate, and the data were presented as mean ± SEM (n = 6) (*p < 0.05, **p < 0.01, ***p < 0.001, #p > 0.05, not significant).
Data availability statement
All data generated or analyzed during this study are included in this article. Further enquiries can be directed to the corresponding author.