
Figures & data
Figure 1. Schematic Of cervical elastography ROI localization with dual-mode grey-scale ultrasound images (left) and real-time elastography (right).
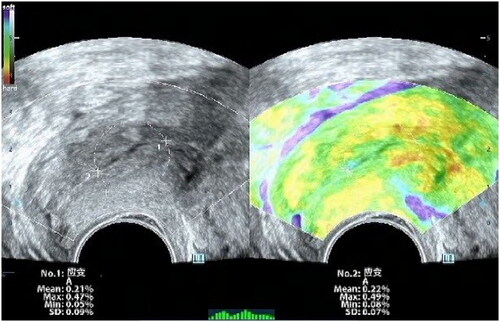
Figure 2. Schematic Diagram of uterine artery RI measurement.
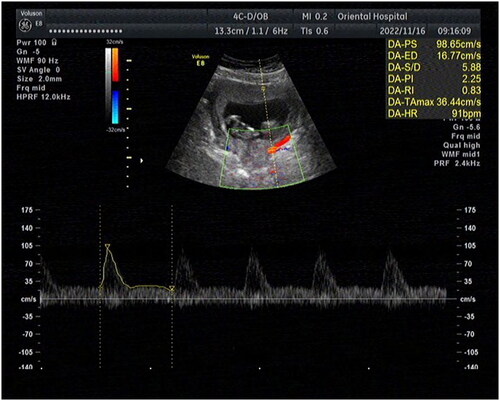
Table 1. Maternal characteristics and neonatal outcomes of the study group.
Table 2. Cervical elastography, cervical length and arteria uterina RI width of the study group.
Figure 3. Box-And-whisker plots of (A) the strain rate of the internal cervical opening, (B) the strain rate of the external cervical opening, (C) cervical length and (D) arteria uterina RI between the cervical insufficiency and no cervical insufficiency groups.
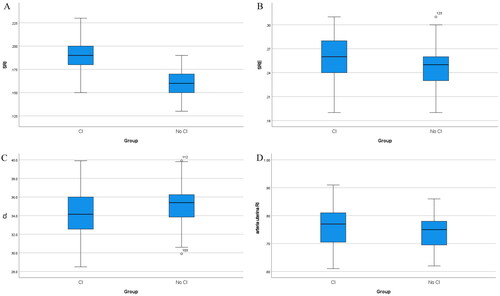
Figure 4. Subject work characteristics (ROC) curves and area under the curve (AUC) for the strain rate of the internal cervical opening, the strain rate of the external cervical opening, cervical length, uterine artery RI and the combination of these five parameters predicting cervical insufficiency of 0.89, 0.66, 0.59, 0.59, 0.59 and 0.92, respectively.
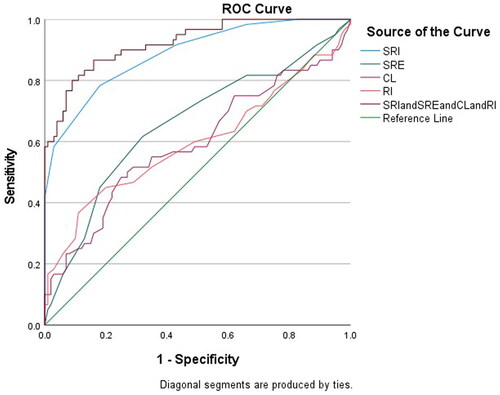
Table 3. ROC curve analyses of cervical elastography, cervical length, and arteria uterina RI width for the diagnosis of cervical insufficiency.
Table 4. Univariate and multivariate logistic regression analyses of individual parameter related to cervical insufficiency.
Data availability statement
The datasets used during the current study are available from the corresponding author on reasonable request.