
Figures & data
Figure 1. Flowchart.
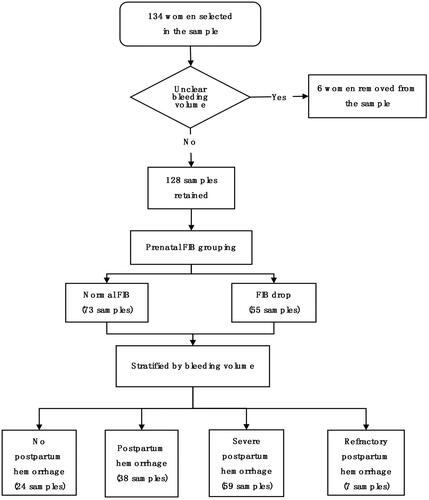
Table 1. Patient characteristics (χ2 test).
Figure 2. The relationship between prenatal fibrinogen and the amount of blood loss (mL). (A) Scatter diagram of prenatal fibrinogen concentration and volume of blood loss. (B) Histogram of prenatal fibrinogen subsection and the mean value of blood loss.
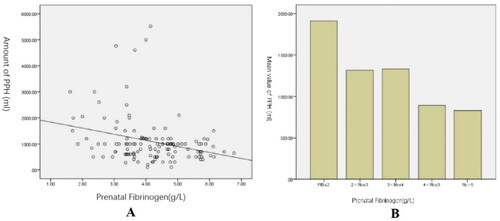
Table 2. Prenatal laboratory examination.
Table 3. Multi-factor linear regression equation about the mean value of PPH and six major factors for PPH.
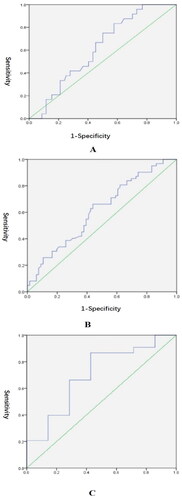
Figure 3. ROC curves of prenatal FIB for the degree of PPH. (A) Test variables: prenatal FIB; state variable: PPH or not; area under curve = 0.614 (p = .082); Standard error = 0.054; 95% CI = 0.507–0.721. (B) Test variable: prenatal FIB; state variable: severe PPH or not; area under curve = 0.613 (p = .027); standard error = 0.050; 95% CI = 0.516–0.710. (C) Test variable: prenatal FIB; state variable: refractory PPH or not; area under curve = 0.701 (p = .074); standard error = 0.107; 95% CI = 0.492–0.910.
Supplemental Material
Download MS Excel (131 KB)Data availability statement
The authors confirm that the data supporting the findings of this study are available within the supplementary materials.