
Figures & data
Table 1. Overview of echocardiographic parameters for the evaluation of pulmonary artery pressure, pulmonary vascular resistance, and shunts in persistent pulmonary hypertension of the newborn.
Figure 1. Tricuspid regurgitation peak velocity (Vmax TR). The estimation of systolic pulmonary artery pressure (sPAP) can be derived from the tricuspid regurgitation jet. The peak velocity of the tricuspid regurgitation jet measures 3.95 m/s, which corresponds to a maximum pressure gradient of 62.41 mmHg as per the modified Bernoulli equation.
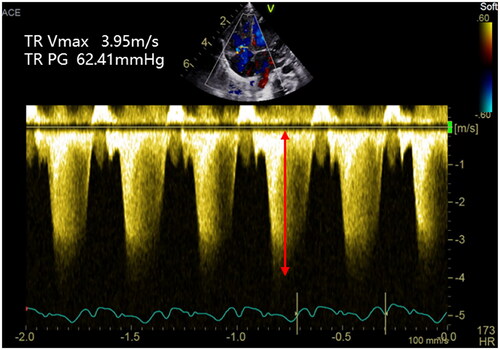
Figure 2. Peak pulmonary regurgitation flow velocity (VmaxPR). The estimation of mean pulmonary artery pressure (mPAP) can be derived from the pulmonary regurgitation jet. The peak velocity of the pulmonary regurgitation jet measures 1.95 m/s, which corresponds to a maximum pressure gradient of 15.21 mmHg as per the modified Bernoulli equation.
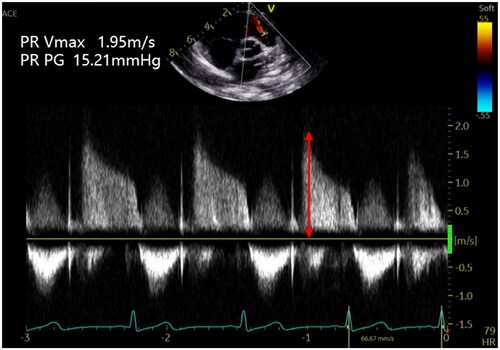
Figure 3. Right ventricular systolic time intervals. PAAT: pulmonary artery acceleration time; RVET: right ventricular ejection time.
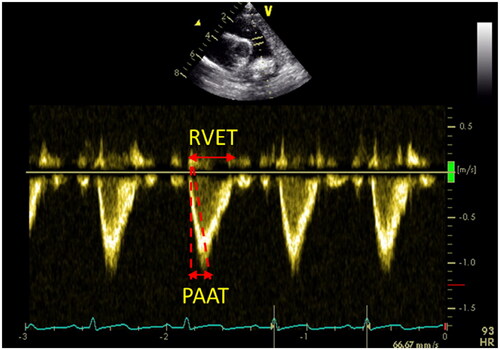
Figure 4. LV systolic eccentricity index (LV-sEI). The LV-sEI was obtained at the level of the parasternal left ventricular short-axis papillary muscle. LVsEI = D1 (LV internal diameter parallel to the IVS)/D2 (LV internal diameter perpendicular to the IVS).
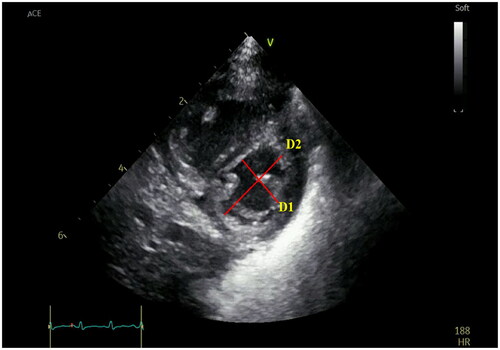
Figure 5. Tricuspid annular plane systolic excursion (TAPSE). TAPSE is a measure of RV longitudinal function and obtained from the 4-chamber view using the M-Mode with the cursor aligned along the direction of the lateral annulus.
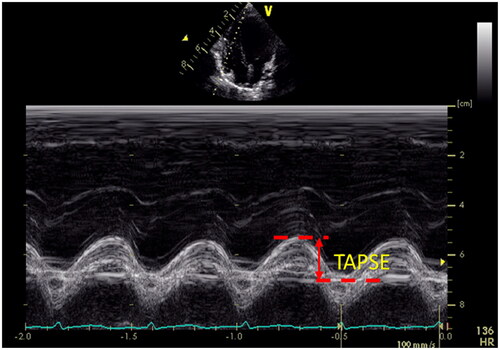
Figure 6. Right ventricular global longitudinal strain (RV GLS). The endocardial boundary of the right ventricle was automatically delineated using two-dimensional speckle tracking echocardiography on the apical 4-chamber view, with a specific focus on the RV. This included the RV apical segment, RV free wall, and RV interventricular septum to demonstrate the maximum diameter of the RV. The myocardial segments visualized by two-dimensional speckle tracking echocardiography comprised the basal, middle, and apical segments of the RV free wall, as well as the apical, middle, and basal segments of the RV interventricular septum. The RV GLS value in the figure is −19.7%.
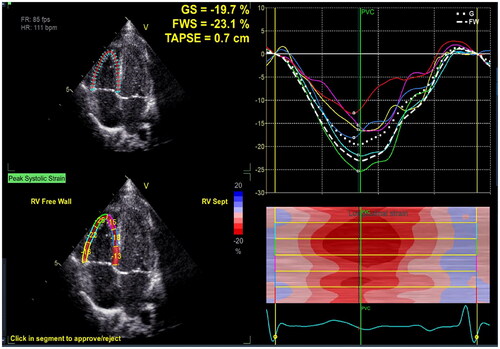
Figure 7. Myocardial Performance Index—Tei index. The Tei index obtained by Tissue Doppler is illustrated in the figure. Tei index = the sum of isovolumic contraction and relaxation time divided by ejection time (a − b/a).
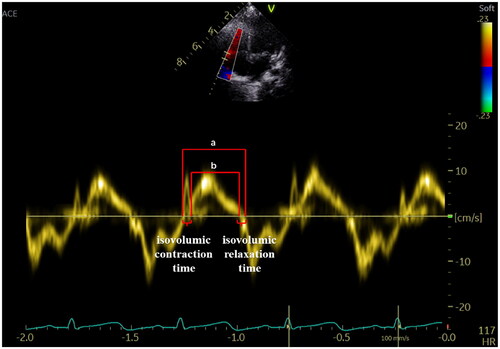
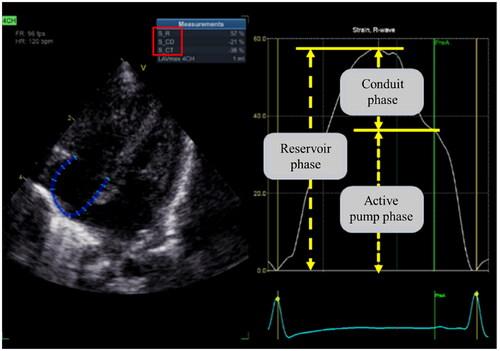
Figure 8. Right atrial strain (RA LS). The endocardial boundary of the right atrial was automatically delineated using two-dimensional speckle tracking echocardiography on the apical 4-chamber view, with a specific focus on the RA. RA LS consists of three phases: the reservoir phase, the conduit phase, and the active pump phase.
Data Availability statement
Data availability is not applicable to this article as no new data were created or analyzed in this study.