
Figures & data
Figure 1. The levels of LncRNA-KCNQ1OT1, miR-29a-3p, SOCS3 mRNA, and SOCS3 protein expression in the abortion tissues of women with URSA. Panel A denotes the expression of KCNQ1OT1, Panel B shows the expression of miR-29a-3p, Panel C displays the expression of SOCS3 mRNA, and Panel D represents the expression of SOCS3 protein. *Compared with the control group, Wilcoxon rank-sum test, p < 0.05.
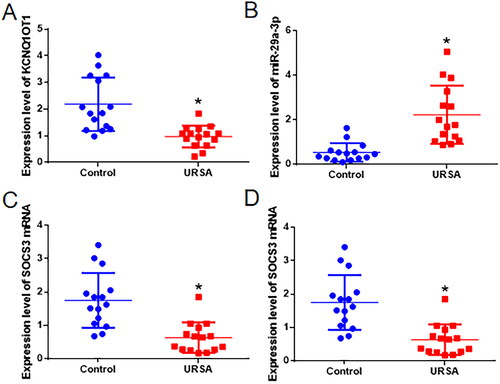
Figure 2. Influence of inhibiting KCNQ1OT1 on the growth and programmed cell death of HTR8/SVneo cells. In A, KCNQ1OT1 expression is measured using qRT-PCR. In B, the CCK-8 assay is employed to evaluate cell growth in both sets of cells. C depicts the evaluation of cell apoptosis via flow cytometry, while D depicts the determination of cell apoptosis-related markers through qRT-PCR.* Compared with the Si-NC group, p < 0.05.
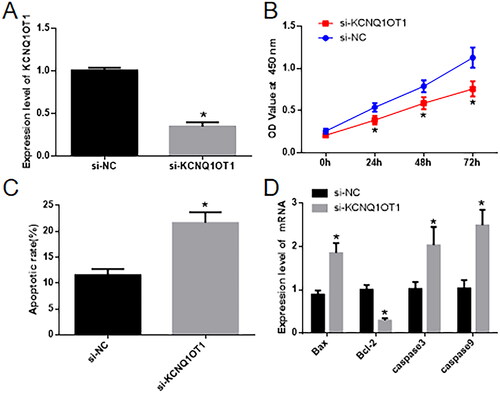
Figure 3. KCNQ1OT1 enhances SOCS3 expression by acting as a sponge to absorb miR-29a-3p. (A) Displays the outcomes of RNA FISH, revealing the presence of KCNQ1OT1 in both the cellular cytoplasm and nucleus. (B) Displays the statistical assessment of the dual-luciferase reporter assay, while (C) displays the statistical analysis of the RNA pull-down assay. (D) Displays the statistical analysis of the RNA-IP experiment.*Compared with the NC mimic group, p < 0.05; #compared with Mut-miR-29a-3p, p < 0.05; & compared with anti-IgG, p < 0.05.
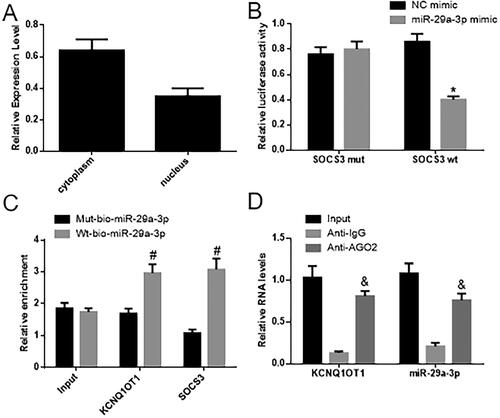
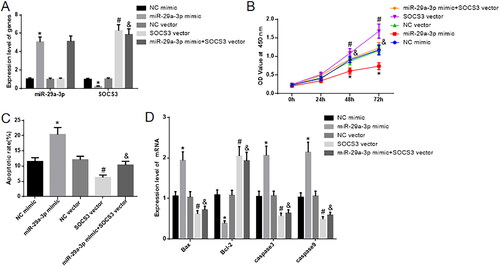
Figure 4. miR-29a-3p hinders the growth of human villous trophoblast cells and encourages their programmed cell death by suppressing the activity of SOCS3. (A) Displays the measurement of miR-29a-3p and SOCS3 expression using qRT-PCR. (B) Displays the utilization of a CCK-8 assay to assess cell proliferation. (C) Displays the application of flow cytometry to observe cell apoptosis. (D) Displays the evaluation of cell apoptosis-related markers through qRT-PCR. Tukey HSD* Compared with the NC mimic group, p < 0.05; #compared with NC vector, p < 0.05; &compared with the miR-29a-3p mimic, n = 3, p < 0.05.
Supplemental Material
Download MS Word (415.6 KB)Data availability statement
All data generated or analyzed during this study are included in this article. Further enquiries can be directed to the corresponding author.