
Figures & data
Figure 1. Flow diagram of the study selection.
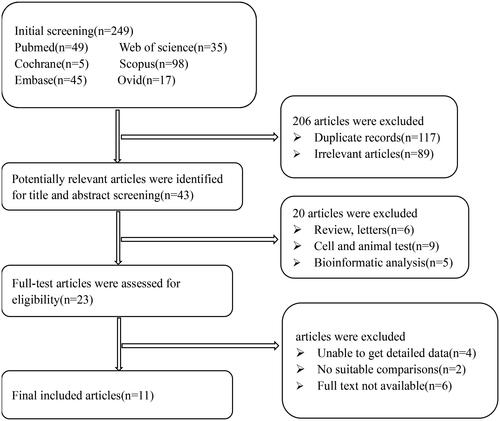
Figure 2. A summary of methodological qualities of included articles.
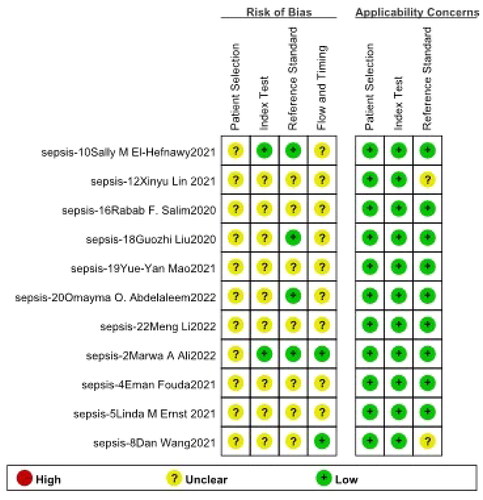
Table 1. Characteristics of the included studies and participants.
Figure 3. Diagnostic odds ratio of included studies.
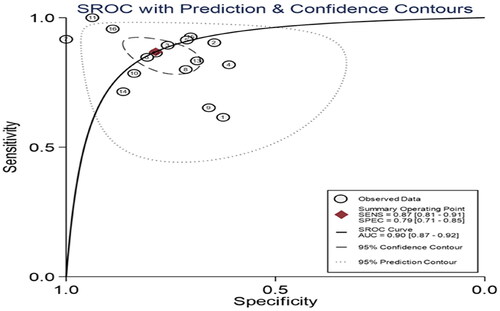
Figure 4. Forest plots of pooled sensitivity and specificity of miRNAs.
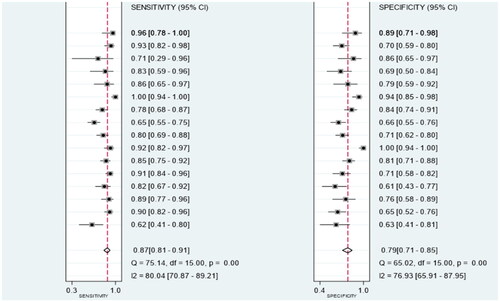
Figure 5. Heterogeneity analysis. (a) Goodness-of-fit; (b) bivariate normality; (c) influence analysis; (d) outlier detection.
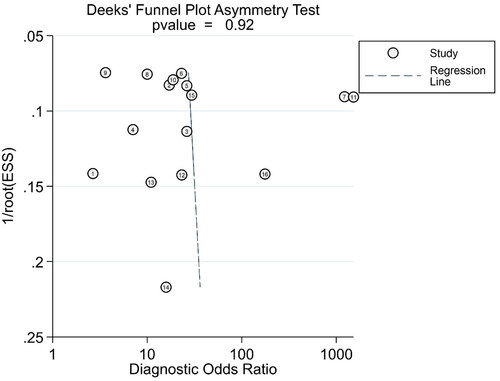
Figure 6. Summary receiver operating characteristic curve value of circulating miRNAs.
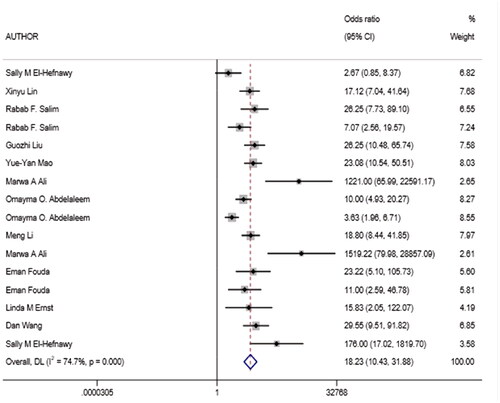
Table 2. Diagnostic value of circulating miRNAs and PCT.
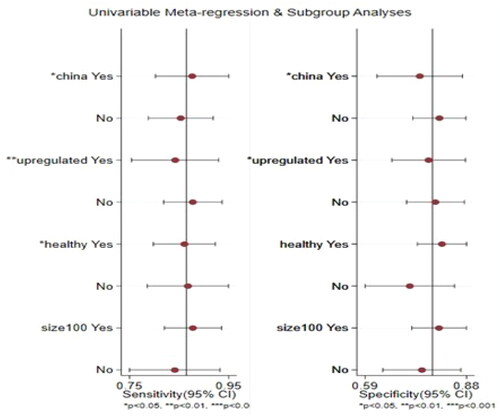
Figure 7. Meta-regression and subgroup analysis.
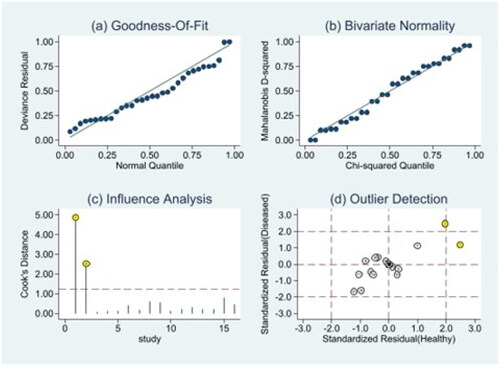
Table 3. Summary diagnostic power based on subgroup analysis.
Figure 8. Deek’s funnel plot.
Data availability statement
Data availability is not applicable to this article as no new data were created or analyzed in this study.