Figures & data
Table 1. The compositions (wt. %) and standard deviation (SD) of the as-cast AA6082 Al alloy prepared via direct chill (DC), direct chill casting using melt conditioning (DCMC) and direct chill casting with grain refinement addition Al-5Ti-1B (DCGR).
Figure 1. The back-scattered electron SEM images of the microstructure of AA6082 Al alloy in the as-cast DC, DCGR and DCMC conditions. The precipitation of the plate, Chinese script, string and circular shaped features has taken place.
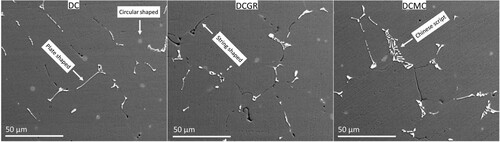
Figure 2. The back-scattered electron images of three casting conditions and the corresponding elemental maps. The labellings show the main element composition of the indicated phases.
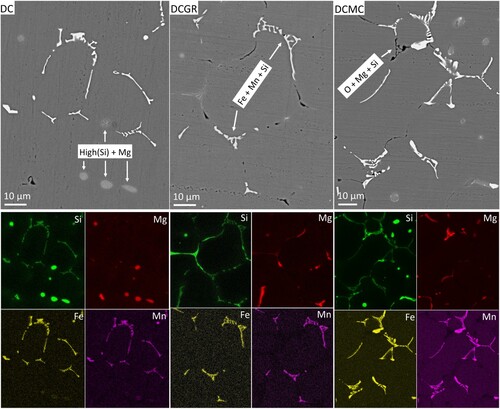
Figure 3. The qualitative electron probe micro-analysis (EPMA) maps of Si and Mg segregation in three different casting conditions. The EPMA maps are purposefully enhanced to reveal the minor segregation bands. The line scans are indicated with white dashed lines. The concentration (at.%) vs distance (μm) plots correspond to the respective line scans in the EPMA maps.
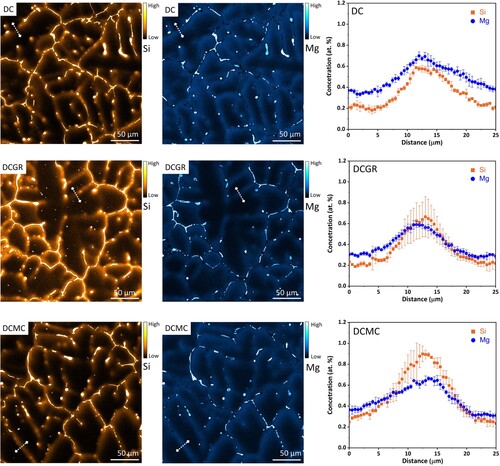
Figure 4. The observed morphology in the micro-segregation bands in the DCGR cast. The TEM image of a hexagonal-shaped alpha-phase iron-rich particle, corresponding electron diffraction, elemental maps and noise filtered atomic-scale HAADF-STEM image along the zone axis of the cubic alpha iron-rich phase.
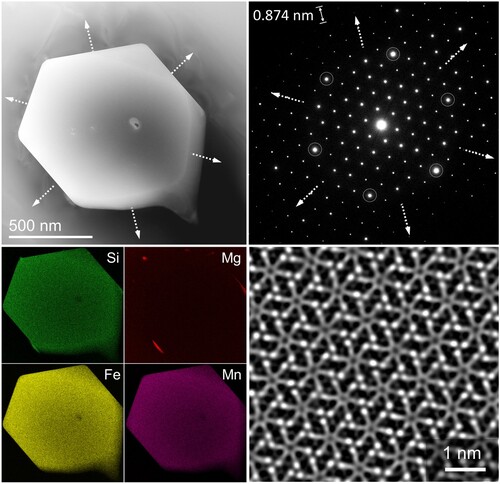
Figure 5. (A0) The HAADF-STEM image of the microstructure along the [001] aluminium zone axis, next to a coarse dendritic feature in the DCGR cast. (A1) The enlarged area marked with dashed white lines in the AO image. (A2) The area marked with white dashed lines in the A1 image and the corresponding elemental maps.
![Figure 5. (A0) The HAADF-STEM image of the microstructure along the [001] aluminium zone axis, next to a coarse dendritic feature in the DCGR cast. (A1) The enlarged area marked with dashed white lines in the AO image. (A2) The area marked with white dashed lines in the A1 image and the corresponding elemental maps.](/cms/asset/cbb43ad1-0407-4366-9507-99116d50879d/tphm_a_2336012_f0005_oc.jpg)
Figure 6. The TEM and STEM imaging along the [001] aluminium zone axis, next to a coarse intermetallic in the minor-segregation bands in the DCGR cast. (A0) TEM image of the microstructure next to a coarse intermetallic. (A1) The enlarged TEM image of the area marked with dashed black lines in the A0 image. (A2) The HAADF-STEM image of the area marked with dashed black lines in the upper part of the A1 image. (1 & 2) The precipitates 1 and 2 imaged in their entirety using HAADF-STEM mode. The unfiltered atomic-scale images of the cross-sections of the precipitates 1 and 2 marked with white dashed lines. The overlaying of the Si-rich atomic columns in green and Cu-rich atomic columns in blue, and the corresponding FFTs. In the FFTs, the white circles indicate the Al matrix, and the white dashed circles indicate the Si network reflections.
![Figure 6. The TEM and STEM imaging along the [001] aluminium zone axis, next to a coarse intermetallic in the minor-segregation bands in the DCGR cast. (A0) TEM image of the microstructure next to a coarse intermetallic. (A1) The enlarged TEM image of the area marked with dashed black lines in the A0 image. (A2) The HAADF-STEM image of the area marked with dashed black lines in the upper part of the A1 image. (1 & 2) The precipitates 1 and 2 imaged in their entirety using HAADF-STEM mode. The unfiltered atomic-scale images of the cross-sections of the precipitates 1 and 2 marked with white dashed lines. The overlaying of the Si-rich atomic columns in green and Cu-rich atomic columns in blue, and the corresponding FFTs. In the FFTs, the white circles indicate the Al matrix, and the white dashed circles indicate the Si network reflections.](/cms/asset/12512296-acc3-43ed-842f-70d2feece274/tphm_a_2336012_f0006_oc.jpg)
Figure 7. (a, b) The unfiltered atomic-scale HAADF-STEM images along the [001] aluminium zone axis, revealing the precipitate cross-sections of the heterogeneously nucleated precipitates. (I, II, III, IV) The enlarged parts from the different precipitate cross-section areas and the respective metastable phases. The atomic coordinates of the atomic columns parallel with the incident beam (z-coordinates) are neglected.
![Figure 7. (a, b) The unfiltered atomic-scale HAADF-STEM images along the [001] aluminium zone axis, revealing the precipitate cross-sections of the heterogeneously nucleated precipitates. (I, II, III, IV) The enlarged parts from the different precipitate cross-section areas and the respective metastable phases. The atomic coordinates of the atomic columns parallel with the incident beam (z-coordinates) are neglected.](/cms/asset/9a107447-734f-4613-b752-cfb5ff9fa0c8/tphm_a_2336012_f0007_oc.jpg)
Figure 8. The TEM and STEM image of the microstructure in the minor-segregation bands in the DCGR cast. (A0) The TEM image of the same area as in the (A1). (A1) The enlarged HAADF-STEM image of the area marked with dashed black lines in the A0 image. The homogenous precipitation has taken place. (a, b) The unfiltered atomic-scale HAADF-STEM image of the precipitates homogeneously nucleated inside the Al matrix and their corresponding FFTs.
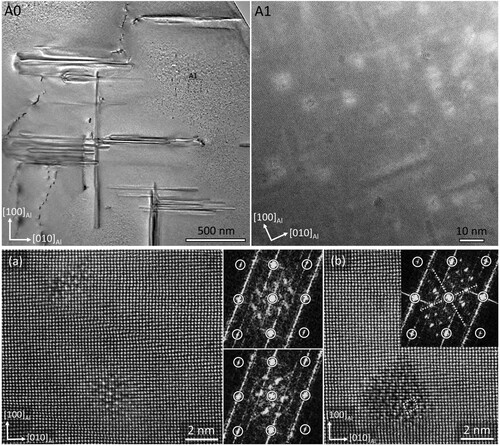
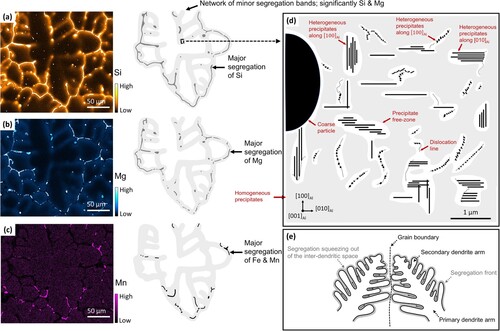
Figure 9. The EPMA maps of segregation pattern in the DCGR cast. (a) The Si segregation map and its schematic. (b) The Mg segregation map and its schematic. (c) The Mn segregation map and its schematic. The Mn segregation map is equivalent to the Fe segregation map. Check Appendix. (d) Illustration of the microstructure of the minor-segregation band. (e) Two aluminium dendrites prior to the bump into an aluminium dendritic boundary.