Figures & data
Table 1. Number of participants, age and gender by hearing clinic.
Table 2. Demographic data and general fitting strategies of audiologists.
Figure 1. Frequency of problems experienced when listening to music (a [n = 175]), and extent to which this negatively affects quality of life ( b [n = 167]) across all participants.
![Figure 1. Frequency of problems experienced when listening to music (a [n = 175]), and extent to which this negatively affects quality of life ( b [n = 167]) across all participants.](/cms/asset/dca17974-1d44-44ff-a63a-91a738e43fdf/iija_a_1762126_f0001_b.jpg)
Figure 2. Do you experience problems when listening to music? Thematically coded responses (n = 105, percentages sum >100% as participants contributed to >1 theme).
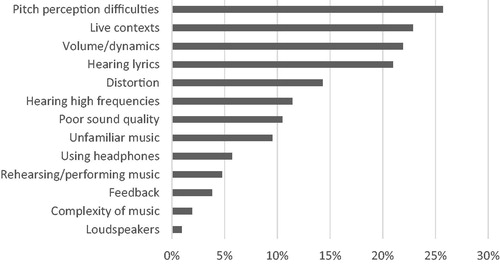
Figure 3. Do problems listening to music negatively affect your quality of life? Thematically coded responses (n = 76, percentages sum >100% as participants contributed to >1 theme).
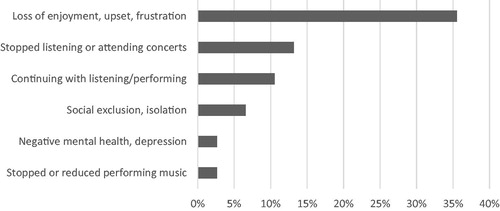
Figure 4. Frequency of discussions in clinic across all participants (a [n = 173]) and degree to which this has improved music listening experiences among those who had discussed music at least once ( b [n = 50]).
![Figure 4. Frequency of discussions in clinic across all participants (a [n = 173]) and degree to which this has improved music listening experiences among those who had discussed music at least once ( b [n = 50]).](/cms/asset/4aedb0cf-fb0b-49b5-949a-4899a6c536e3/iija_a_1762126_f0004_b.jpg)
Figure 5. Have you ever talked to your audiologist about music listening? Thematically coded responses (n = 65, percentages sum >100% as participants contributed to >1 theme).
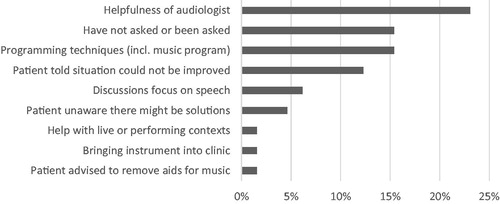
Figure 6. Percentage of patients who ask about issues related to music listening (a [n = 93]), and percentage of practitioners who report they ask patients about music in clinic (b, [n = 87]).
![Figure 6. Percentage of patients who ask about issues related to music listening (a [n = 93]), and percentage of practitioners who report they ask patients about music in clinic (b, [n = 87]).](/cms/asset/8ca933c0-08db-45ad-89e6-e6329a856b4e/iija_a_1762126_f0006_b.jpg)
Figure 7. How frequently audiologists discussed various music topics in percentage (n = 93).
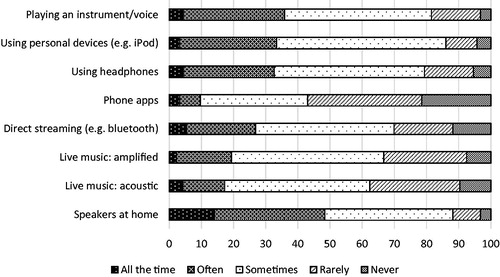
Figure 8. Audiologists’ rated usefulness of hearing aids are for music listening (n = 93).
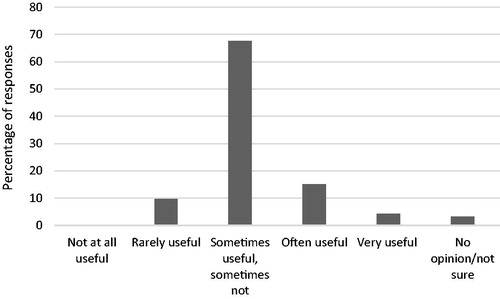
Figure 9. Rated confidence in providing advice about music listening (a [n = 93]) and confidence fitting a music listening programme on hearing aids (b [n = 93]).
![Figure 9. Rated confidence in providing advice about music listening (a [n = 93]) and confidence fitting a music listening programme on hearing aids (b [n = 93]).](/cms/asset/8410bd09-4a48-4c31-8c07-6678c58e8c52/iija_a_1762126_f0009_b.jpg)
Figure 10. Years’ experience in programming hearing aids for music (a [n = 79]), and percentage of patients that practitioners programme a music programme for (b [n = 80]).
![Figure 10. Years’ experience in programming hearing aids for music (a [n = 79]), and percentage of patients that practitioners programme a music programme for (b [n = 80]).](/cms/asset/329d85e8-3a72-40bc-a86c-b9f63f563b4d/iija_a_1762126_f0010_b.jpg)
Figure 11. Strategies for programming hearing aids. Thematically coded responses (n = 53, percentages sum >100% as participants contributed to >1 theme).
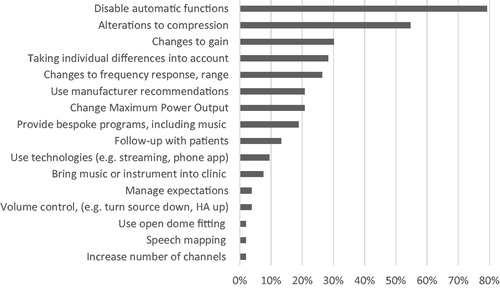
Figure 12. What kind of training relating to music listening did you receive? Thematically coded responses (n = 35, percentages sum >100% as participants contributed to >1 theme).
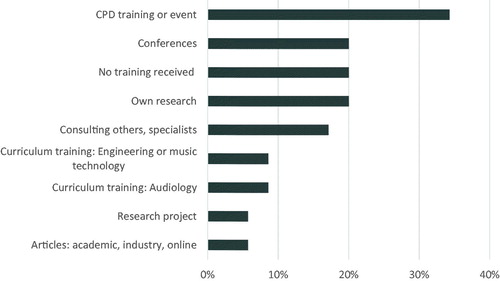
Figure 13. Information sought about music listening for patients. Thematically coded responses (n = 35, percentages sum >100% as participants contributed to >1 theme).
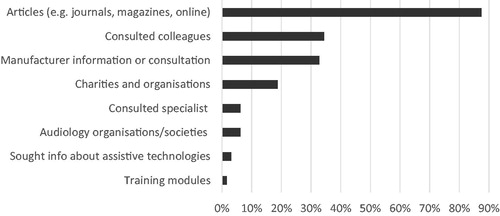
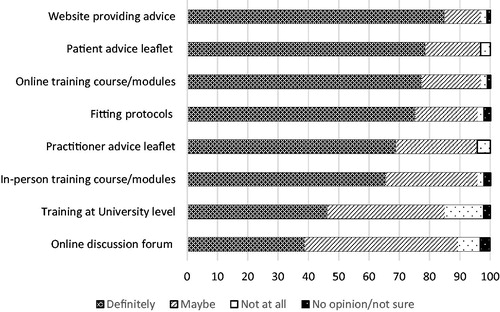
Figure 14. Audiologists’ rated usefulness of resources on music and hearing aids in percentage (n = 93).