Figures & data
Figure 1. Trial Profile. Numbers of completed International Outcome Inventory for Hearing Aids (IOI-HA) answers from baseline and follow-up for first-time and experienced hearing aid (HA) users are shown.
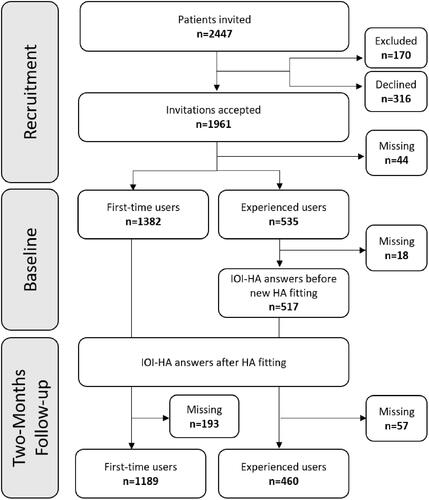
Table 1. Statistical analyses performed in the study and the type of statistical tests used in these analyses.
Table 2. Factor loadings for each of the seven IOI-HA items on each extracted factor after principal component analysis with varimax rotation (n = 1643).
Table 3. Population characteristics.
Figure 2. Boxplots showing distribution of data logged hearing aid usage time by degree of hearing loss in experienced and first-time users. The thick horizontal lines show medians, dot shows the mean, the lower and upper edges of the boxes show the first and third quartiles, and the whiskers indicate 10th and 90th percentiles.
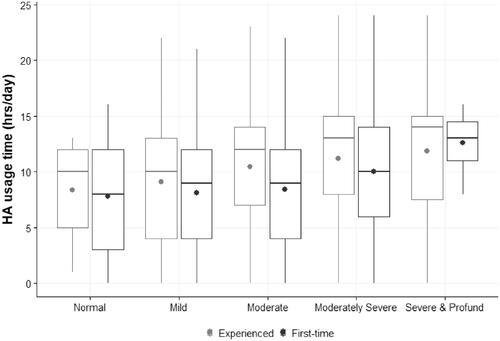
Figure 3. Boxplots showing International Outcome Inventory for Hearing Aids (IOI-HA) scores by level of hearing aid experience. The thick horizontal lines show medians, thick dot shows the mean, the lower and upper edges of the boxes show the first and third quartiles, and the whiskers indicate 10th and 90th percentiles. Outliers are marked with a dot. Usage time (Use), Benefit (Ben), Residual Activity Limitation (RAL), Satisfaction (Sat), Residual Participation Restriction (RPR), Impact on others (Ioth), and Quality of Life (QoL).
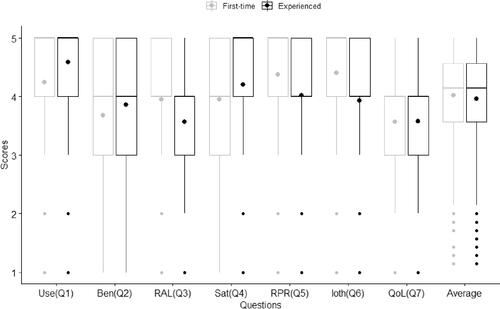
Figure 4. Boxplots showing International Outcome Inventory for Hearing Aids (IOI-HA) Factor 1 (Benefit) and Factor 2 (Residual difficulty) scores at follow-up by level of hearing aid (HA) experience. The thick horizontal lines show medians, thick dot shows the mean, the lower and upper edges of the boxes show the first and third quartiles, and the whiskers indicate 10th and 90th percentiles. Outliers are marked with a dot.
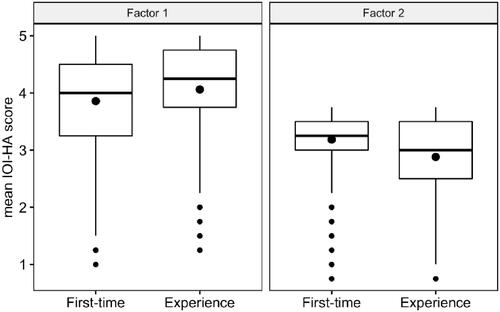
Table 4. Multiple linear regression analysis for International Outcome Inventory for Hearing Aids (IOI-HA) Factor 1, Factor 2, and total IOI-HA follow-up scores in first-time (n = 1090) and experienced (n = 417) users.
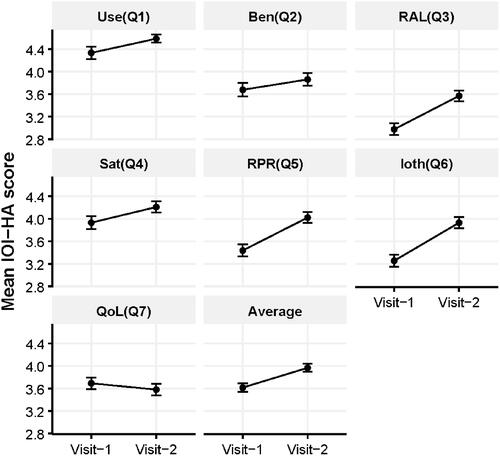
Figure 5. Mean score changes with each of the seven International Outcome Inventory for Hearing Aids (IOI-HA) items and the average of all seven items from baseline (visit 1) to follow-up (visit 2) in experienced users (n = 460). Error bars show standard error of the mean. Use time (Use), Benefit (Ben), Residual Activity Limitation (RAL), Satisfaction (Sat), Residual Participation Restriction (RPR), Impact on others (Ioth), Quality of Life (QoL).