Figures & data
Table 1. Set of words used in the German matrix sentence test.
Figure 1. Example of a frame of the video material.
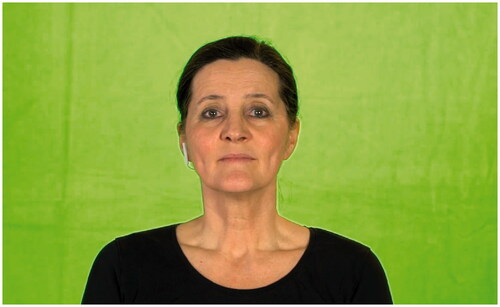
Figure 2. Mel spectrogram of original sentence and one of the four recordings of that sentence.
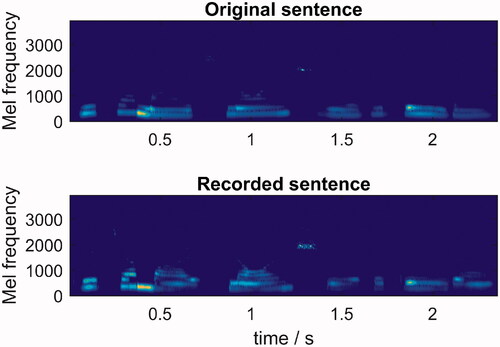
Figure 3. Warping path between the original and two recorded sentences. The best match and the worst match are shown. The size of the shaded surface corresponds to the asynchrony score.
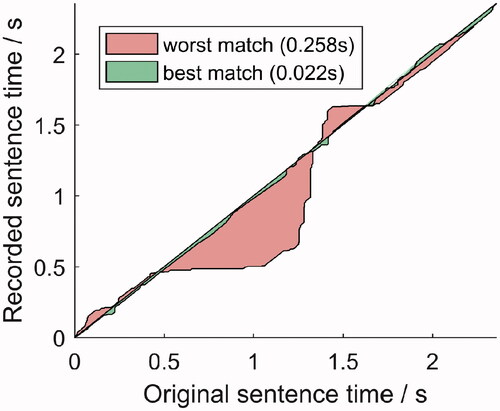
Figure 4. Asynchrony scores comparing the original sentences and their best-matched recordings before manual correction of the three outliers (left; 150 scores), the original sentences and all 4 of their recordings (middle; 600 scores) and the original sentences and the mismatched recordings (right; 150 × 149 × 4 scores). The vertical axis is on a logarithmic scale. The mean is represented as a red cross and the median as a green square. The outliers are depicted with black circles.
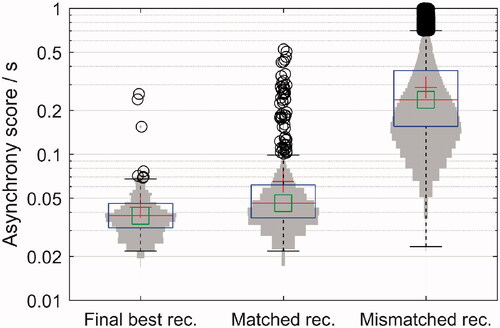
Table 2. Conditions tested for the evaluation and validation of the AV-OLSA.
Figure 5. Ordering of the lists in the test and retest sessions. Conditions stacked in columns were pseudo-randomized within the column. If the participants were trained in AVNoise with the open-set format, they performed the open-set format lists before the closed-set lists; if they were trained with the closed-set format, they proceeded with the closed-set format lists before doing the open-set lists.
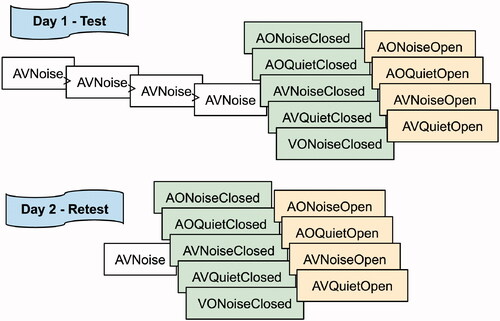
Figure 6. Audiovisual training effects. The average and the standard deviation of SRTs over groups are shown. The black dashed line with circles shows the SRTs of the 13 participants that did the training in closed response format. The continuous grey line with whiskers shows the SRTs of the 15 participants that did the training in open response format. It should be noted that, due to the other measurement conditions, there could be up to 4 lists in between the Training 4 and Test lists and between Training Retest and Retest lists.
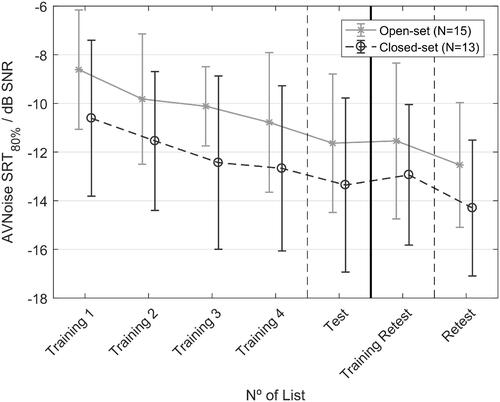
Table 3. Mean audio-only and audiovisual SRTs and between-subjects standard deviations in the test and retest sessions (56 scores per cell).
Figure 7. Adaptive SNRs and speech presentation levels for AVQuiet (top) and AVNoise (bottom) conditions. The adaptive procedure changed the speech levels to reach 80% intelligibility. Below the horizontal line at 0 dB SPL (top) and at -20 dB SNR (bottom), participants understood speech using only visual cues. Each line shows a single list, adding up to 4 lines per participant in each subfigure.
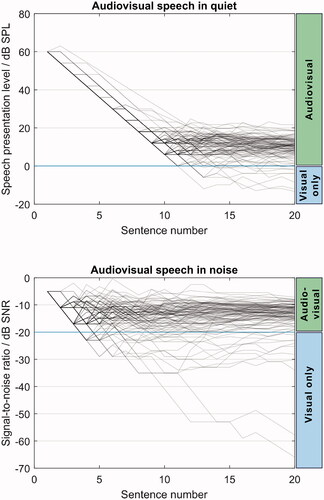
Figure 8. Boxplot and distribution of the speechreading scores. In this figure, each participant has a data point: the average word scoring percentage over 40 sentences. The mean and the median are represented as a red cross and a green square, respectively.
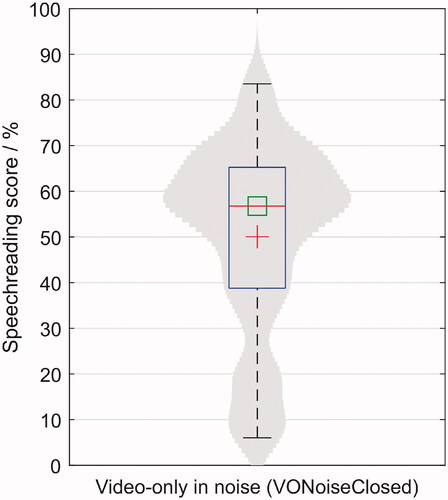
Figure 9. Speechreading scores (VONoiseClosed) shown against the audiovisual benefit of each participant; each participant has two circles per plot for test and retest lists. Top left: audiovisual benefit in noise with closed-set response. This condition was the most similar to the visual-only condition, as both had noise and a closed-set format. Top right: audiovisual benefit in noise with open-set format. Bottom: audiovisual benefit in quiet with closed-set (left) and open-set formats (right).
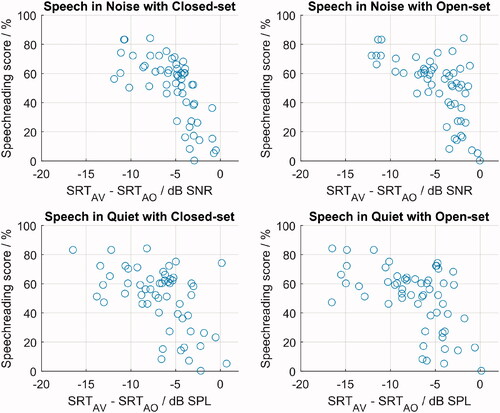
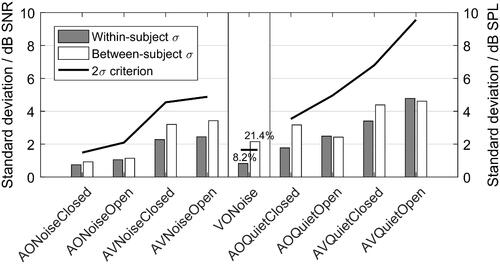
Figure 10. Within-subject (grey bars) and between-subject (white bars) standard deviations for all conditions. The 2σ criterion is indicated as a thick black line. On the left, STDs of speech in noise conditions expressed in dB SNR; on the middle, STDs of the speechreading scores expressed in percentage; and on the right, STDs of speech in quiet expressed in dB SPL.