
Figures & data
Figure 1. Audiograms for the right and left ears of participants (thin lines). Bold lines show the average hearing thresholds. Dashed lines indicate the fitting range of the test devices.
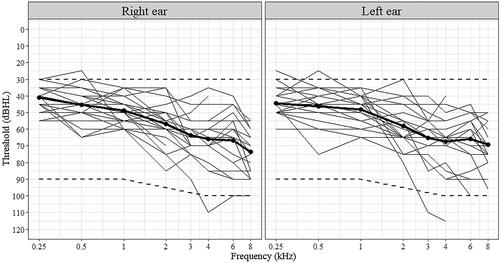
Table 1. Number of participants who passed or failed the assessment tests according to published test score criteria.
Figure 2. Overview of the walking track showing the task sequence during the first walk in the Burlington location. The participant started the walk at the lower right corner (location pin), walked towards the corner of the plaza (solid arrows and corresponding symbols) and back (dashed arrow and symbols). Double speech marker symbols show where the speech inquiry task was performed, while the single speech marker symbol indicates where the story was heard. The bird, frog, and phone symbols show where these sounds were presented.
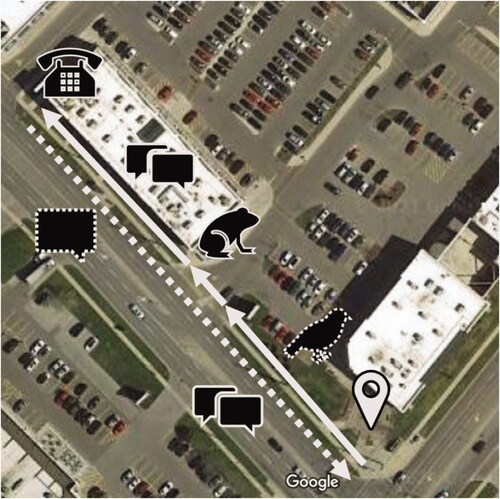
Figure 3. Exemplary page of the questionnaire used during the first walk. The page covers all types of tasks (environmental awareness, “story” speech task, and “inquiry” speech task).
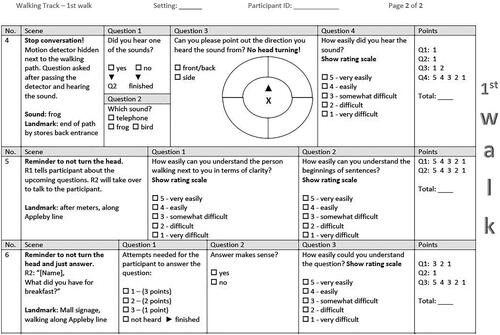
Figure 4. Detection of walking activity (grey line) and beamformer activation (black line) over 9 min. At y = 0, the sensor did not detect walking, and at y = 1, walking was detected. The y-axis value 0.2 corresponds to the activation of “Real Ear Sound”, while y-axis value 1 corresponds to the activation of “UltraZoom”.
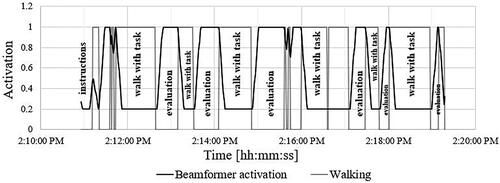
Figure 5. (a and b) Average speech understanding ratings (a) and median speech understanding accuracy scores (b). Bold horizontal lines represent means and medians, with vertical lines showing one standard deviation and 10th percentiles. Boxes in 5b indicate the 1st and 3rd quartiles. Grey dots represent individual data points, with white dotted circles representing data points that are more than two standard deviations away from the mean. Please see Figure 6(a,b) in the SDC for scatterplots of individual results with ON and OFF.
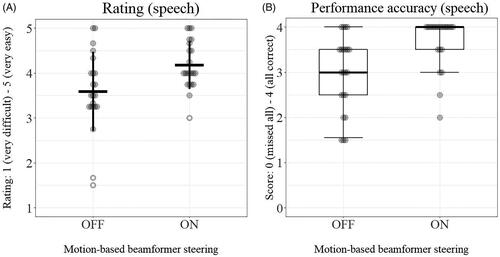
Table 2. Number (percentage) of participants who preferred the walk with the motion-based beamformer adaptation on or off for speech understanding, environmental awareness, and overall listening experience.
Figure 6. (a and b) Median environmental awareness ratings (a) and median localisation accuracy scores (b). Bold horizontal lines represent medians, with lower vertical lines showing 10th percentiles. Boxes indicate the 1st and 3rd quartiles. Grey dots represent individual data points. Please see Figures 7(a,b) in the SDC for scatterplots of individual results with ON and OFF. One participant was unable to detect any stimuli with conventional beamformer adaptation, which reduced the participant number in this condition (n = 21).

Figure 7. Number of participants who preferred the condition with the motion-based beamformer adaptation on or off (conventional adaptation) or did not perceive a difference.
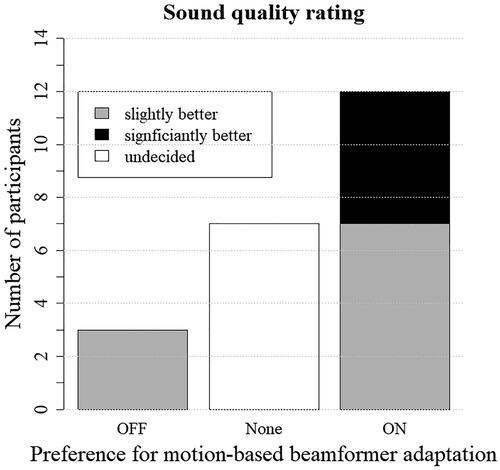
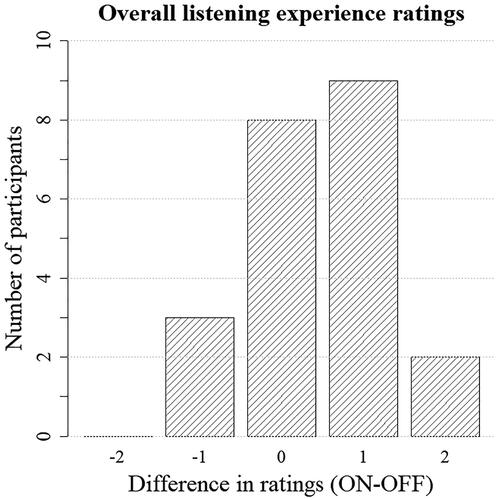
Figure 8. Histogram of the difference in ratings for motion-based beamformer adaptation on and off (conventional adaptation), with a positive value showing higher rating for motion-based beamformer adaptation.