
Figures & data
Figure 1. A picture of the headset model used in this study.
Table 1. Responses to questionnaire on comfort and acceptability of the BC headsets by subjects.
Figure 2. WDT for each condition (“Headset” and “No Headset”) and background (quiet or noise). Individual data points are shown by white circles. The horizontal lines denote the medians. Boxes enclose the interquartile range, and whiskers show the upper and lower quartiles. Data points above or below the upper or lower quartiles, respectively, are outliers. Figure made using the ggplot2 package (Wickham Citation2016) in R (R Core Team Citation2021).
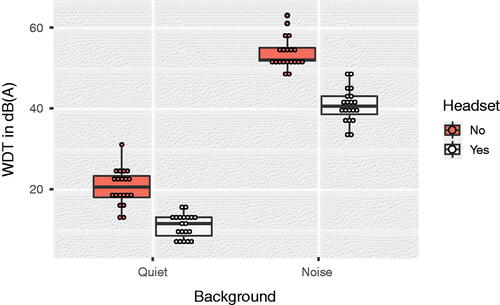
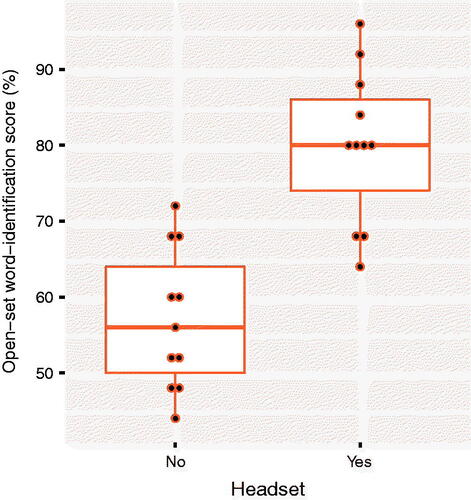
Figure 3. Percent correct scores for the open-set word-identification task. The horizontal lines denote the medians. Boxes enclose the interquartile range, and whiskers show the upper and lower quartiles. Data points above or below the upper or lower quartiles, respectively, are outliers. Figure made using the ggplot2 package (Wickham Citation2016) in R (R Core Team Citation2021).
Supplemental Material
Download MS Word (20.1 KB)Data availability statement
Anonymised data are available on request to the authors.