
Figures & data
Table 1. Reported tinnitus and hearing difficulty by Wave.
Table 2. Relationship between reported symptoms at Wave 1 and Wave 2 for tinnitus (upper section) and hearing difficulties (lower section) separately.
Figure 1. Number and proportion of individuals reporting tinnitus in Wave 2 relative to their reports of tinnitus at Wave 1, along with reported time of onset. Solid grey circles indicate responses that are logically impossible; dashed grey circles indicate responses that are implausible (see text for more explanation). The number and proportion of individuals who reported tinnitus in Wave 1 but who in Wave 2 said they had never had tinnitus is shown in italic font. The nominal 18-month incidence of tinnitus is shown in underlined text.
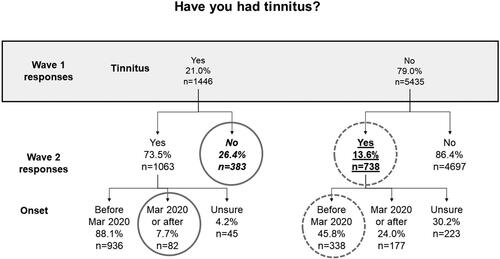
Figure 2. Number and proportion of individuals reporting hearing difficulty in Wave 2 relative to their reports of hearing difficulty at Wave 1, along with time of onset. Solid grey circles indicate responses that are logically impossible; dashed grey circles indicate responses that are implausible (see text for more explanation). The number and proportion of individuals who reported hearing difficulty in Wave 1 but who in Wave 2 said they had never had hearing difficulty is shown in italic font. The nominal 18-month incidence of hearing difficulty is shown in underlined text.
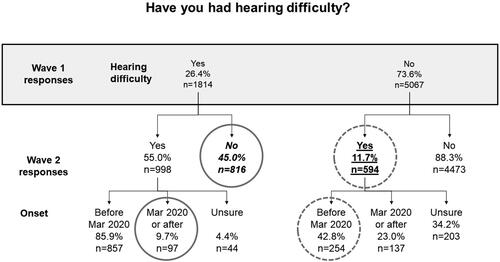
Figure 3. Number and proportion of individuals reporting tinnitus in Wave 1 relative to their reports of tinnitus at Wave 2. Solid grey circles indicate responses that are logically impossible; dashed grey circles indicate responses that are implausible (see text for more explanation). The number and proportion of individuals who reported never having had tinnitus in Wave 2 but who in Wave 1 said they had tinnitus is shown in italic font. The nominal 12-month incidence of tinnitus is shown in underlined text.
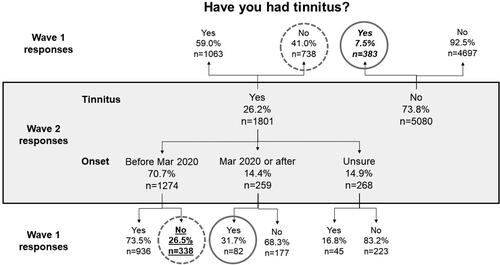
Figure 4. Number and proportion of individuals reporting hearing difficulty in Wave 1 relative to their reports of hearing difficulty at Wave 2. Solid grey circles indicate responses that are logically impossible; dashed grey circles indicate responses that are implausible (see text for more explanation). The number and proportion of individuals who reported never having had hearing difficulty in Wave 2 but who in Wave 1 said they experienced hearing difficulty is shown in italic font. The nominal 12-month incidence of hearing difficulty is shown in underlined text.
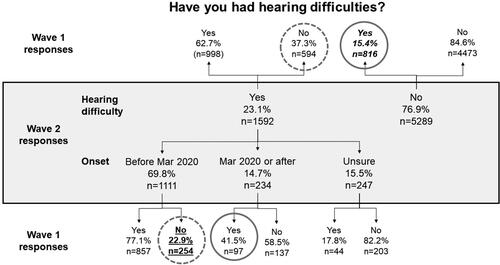
Table 3. Associations between Wave 1 tinnitus and hearing difficulty and Wave 2 severity ratings.