
Figures & data
Figure 1. Difference between the sensation levels elicited by the two different sound paths (bone-conduction versus air-conduction), modelled for the BAHA5P group (N = 35, red lines with circles) and for the BP110 group (N = 35, bluelines with squares) in the situation in quiet with the speaker in front of the subject. Input signal with ISTS spectrum set at 65 dB. If the difference of SL ≥ 0 (black dotted line), a full head-shadow-effect compensation is reached. P50 solid line, P90 dashed line, P10 dotted line. No case fulfils our qualitative analysis criteria.
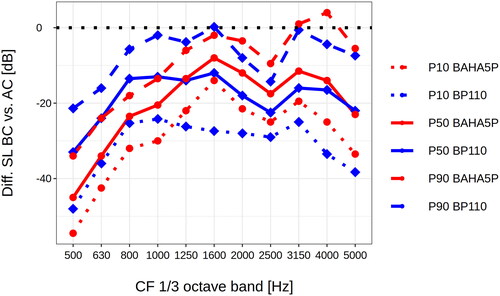
Figure 2. Difference between the sensation levels elicited by the two different sound paths (bone-conduction versus air-conduction), modelled for the BAHA5P group (N = 35, red lines with circles) and for the BP110 group (N = 35, bluelines with squares) in the situation in quiet with the speaker at the BCD side of the subject, with the ISTS set at 65 dB. If the difference of SL ≥ 0 (black dotted line), a full head-shadow-effect compensation is reached. P50 solid line, P90 dashed line, P10 dotted line. Three cases from the BAHA5 group fulfil our qualitative analysis criteria.
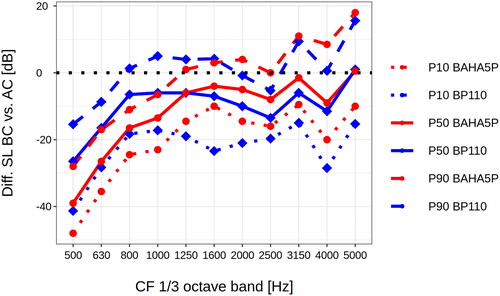
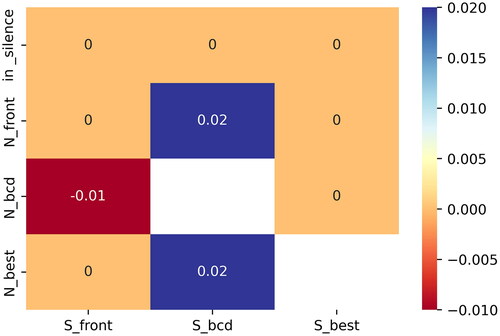
Figure 3. Heatmap representation of the median of the difference between the CVC score of the combined transmission path versus the AC path in the different conditions in quiet and noise. The AC path is equivalent to the unaided situation, and the combination path is equivalent to the aided situation.
Supplemental Material
Download TIFF Image (12.6 MB)Supplemental Material
Download TIFF Image (12.6 MB)Supplemental Material
Download TIFF Image (12.6 MB)Supplemental Material
Download TIFF Image (12.6 MB)Supplemental Material
Download TIFF Image (13.9 MB)Supplemental Material
Download GIF Image (75.4 KB)
Supplemental Material
Download MS Word (14.9 KB)Supplemental Material
Download MS Word (13.2 KB)Data availability statement for basic data sharing policy
The data that support the findings of this study are openly available in the repository Zenodo at https://doi.org/10.5281/zenodo.5573872, DOI reference 10.5281/zenodo.5573872, (version 2.0.0, 5 November 2022). The related software can be retrieved from https://doi.org/10.5281/zenodo.7295482, DOI reference 10.5281/zenodo.7295482