
Figures & data
Table 1. Number of cases with C-SSQ12 ≤ 6.5 in different genders, ages and education levels.
Figure 1. Comparison and distribution of C-SSQ12 scores between different HHIE-S subgroups. C-SSQ12, the Chinese version of short form of Speech, Spatial and Qualities of Hearing Scale; HHIE-S, the Hearing Handicap Inventory for the Elderly-Screening Version; SD, standard deviation.
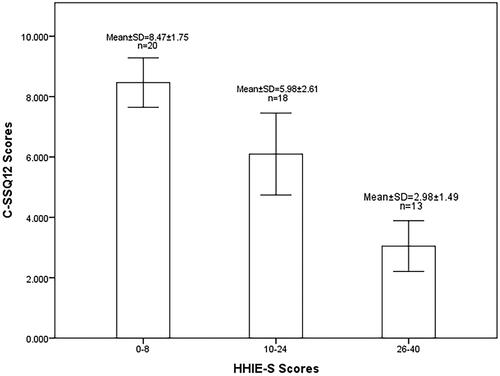
Figure 2. Correlation between C-SSQ12 scores with HHIE-S scores (A) and better ear PTA (B). C-SSQ12, the Chinese version of short form of Speech, Spatial and Qualities of Hearing Scale; HHIE-S, the Hearing Handicap Inventory for the Elderly-Screening Version; PTA, pure-tone average.
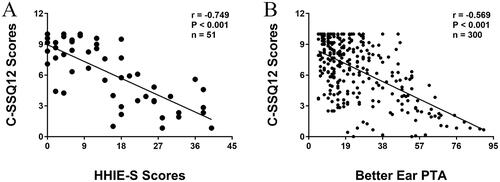
Figure 3. Distribution of C-SSQ12 mean scores and three subscale scores based on the better ear PTA. PTA, pure-tone average; SEM, standard error of the mean.
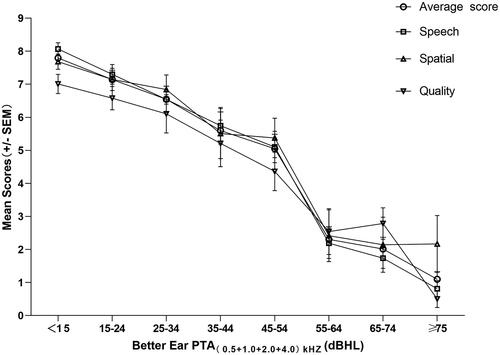
Table 2. Correlation between C-SSQ12 scores and PTA.
Figure 4. Receiver operating characteristic curves for C-SSQ12 scores when worse (A) and better (B) ear PTA > 40dBHL were used as the screening criteria for hearing impairment. AUC, the area under curve.
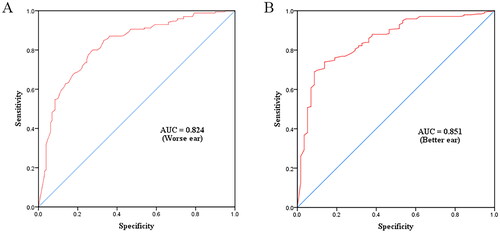
Table 3. Sensitivity, specificity, positive predictive value, negative predictive value and 95% CI of the C-SSQ12 when using a cut-off value of 6.4 and a better ear PTA > 40dBHL as hearing screening criteria.
Table 4. Sensitivity, specificity, positive predictive value, negative predictive value and 95% CI of different C-SSQ12 cut-off values for mild and moderate-to-severe hearing loss.