
Figures & data
Figure 1. Flowchart of sample process and participation.
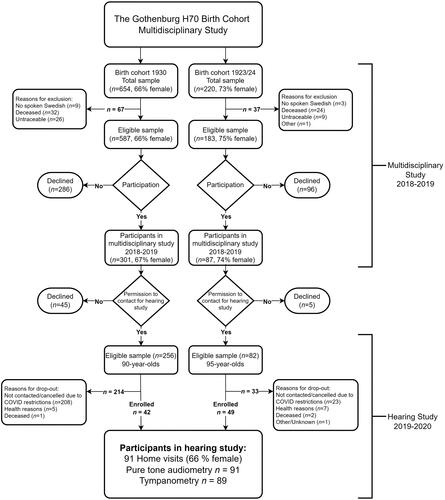
Figure 2. Comparison between participants, drop-outs and same-aged individuals in Gothenburg Municipality and in Sweden overall. Proportions and 95% confidence intervals (Wald intervals for proportions) for study participants regarding: sex, education level, ethnicity and housing. The same characteristics are presented with the proportions for the groups of drop-outs as well as same-aged individuals in Gothenburg Municipality and the population of Sweden. All of the variables are on an aggregated level from Statistics Sweden (SCB). Missing values for drop-outs in the 95-year-olds are due to the number of persons in that category is ≤ 3. * In 90-year-olds no confidence interval regarding special housing could be assessed due to the low number of participants in that group.
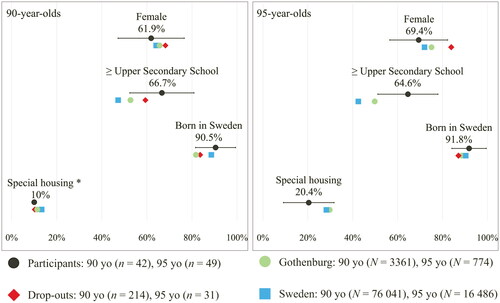
Table 1. Presentation and comparison of sociodemographic characteristics of participants and dropouts among 90- and 95-year-olds recruited to the current study.
Table 2. Prevalence rates of hearing loss degree in the study participants.
Table 3. Prevalence rates of type of hearing loss, tympanometric types, occurrence of cerumen and right-left asymmetry in the study participants.
Figure 3. Interpolated median hearing thresholds and quartile ranges by age groups (females and males combined).
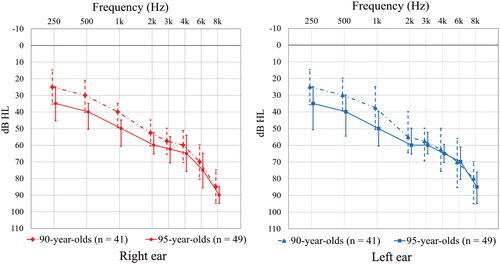
Figure 4. Comparisons of pure-tone averages (PTA) for the right (R) and left (L) ear between the 90-year- and 95-year-olds using PTA4 (0.5, 1, 2, 4 kHz), PTA3 (0.5, 1, 2 kHz) and PTAHF (3, 4, 6 kHz). Median PTA for each group is presented in dB HL in their respective bar. The error bars represent the 25th and 75th quantiles of the respective variable, where the length of the interval equals the interquartile range. The Mann-Whitney U-test indicated a significantly higher average in the older age group for PTA4 and PTA3 (values in bolds). This was not seen for the high frequency PTA. The significance level was set to 0.008 to account for multiple comparisons (six independent comparisons).
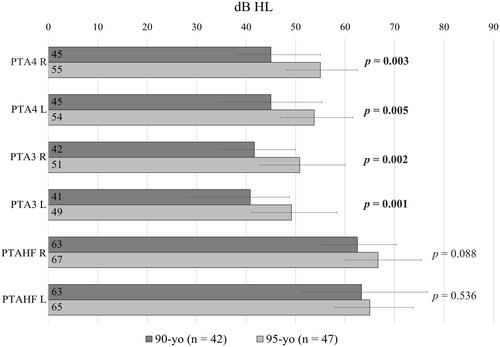
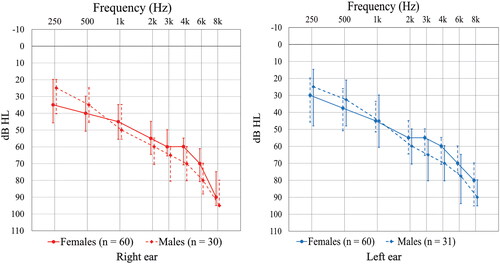
Figure 5. Interpolated median hearing thresholds with quartile ranges by sex (age groups combined).
Supplemental Material
Download MS Word (28.8 KB)Data availability statement
All data and analyses generated during the current study are available from the corresponding author on reasonable request.