
Figures & data
Figure 1. Representation of testing setup for remote assessments.
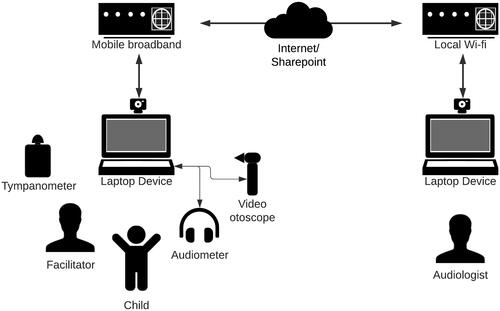
Table 1. Prevalence of hearing loss amongst 464 children tested, based on traditional face-to-face assessment.
Figure 2. Overlayed scatterplots of individual thresholds obtained for A. 1 kHz AC, B. 4 kHz AC, C. 1 kHz BC, and D. 4 kHz BC.
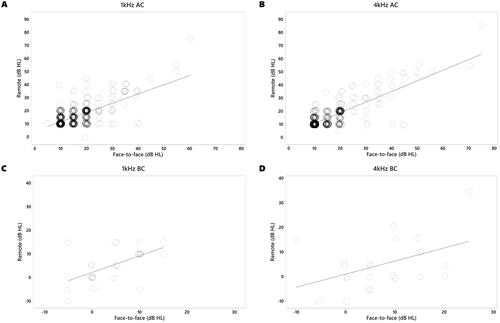
Figure 3. Face-to-face and remote audiograms obtained from one participant with mild conductive hearing loss. Black symbols indicate air conduction and masked bone conduction for traditional assessment, while red and blue symbols indicate thresholds obtained using remote testing for the right and left ear, respectively.
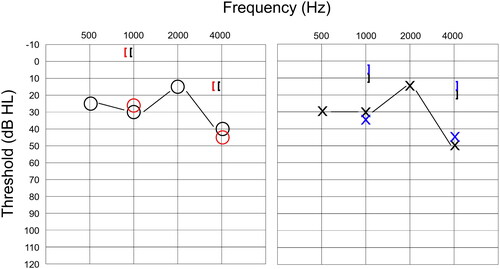
Table 2. Otoscopy classifications and tympanometry types for the sample of 752 ears in test group.