Figures & data
Figure 1. Measurement set-up with equipment as described in the text (a). What is measured and controlled by the boxes “AC40,” “Callisto,” “Agilent” can, in a clinical version, be incorporated in one and the same system such as Callisto from Interacoustics, Verifit from Audioscan or similar other audiometric test systems. To the right, the brass encapsulated microphone unit (b), which is held in place on the forehead by a soft band (c) and a shielding earmuff (d) to avoid direct sound from the speaker to interfere with the microphone unit, altogether forming the skin microphone system.
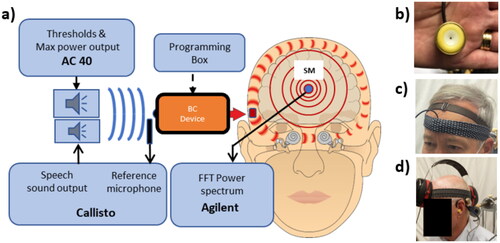
Figure 2. Overall average results (a) as measured directly at the SM output in dB re 0.01 mV, and (b) when normalised by hearing thresholds, where the dynamic range is the area between the MPO and the thresholds. These are averages of individual dB values, which have a large spread among patients.
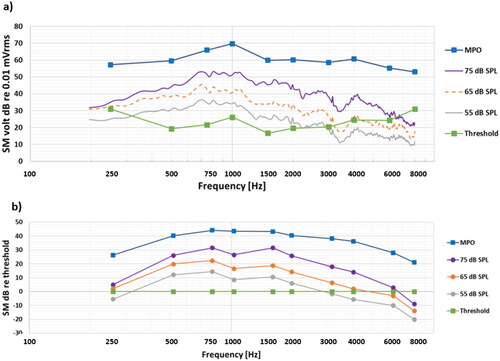
Figure 3. Audibility of 65 dB ISTS speech for the three subgroups of BAHA users, for BCI users, and for Skin drive users.
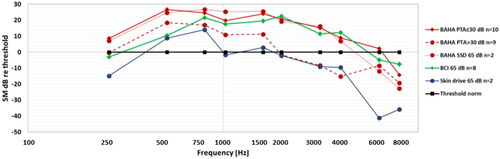
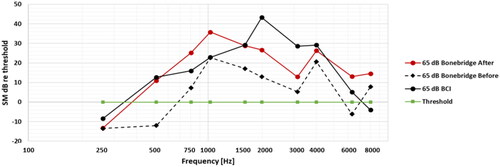
Figure 4. Audibility before (a), where the red circles show areas of lower audibility, and after (b) adjustment of the gain.
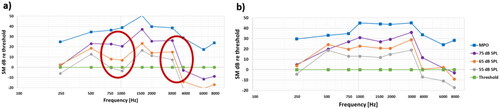
Figure 5. Different active transcutaneous devices on the same patient, one with the original BCI (Chalmers original system), and one with a recently implanted Bonebridge system (MedEl, Austria).