Figures & data
Table 1. Potential remote care solutions considered, listed in increasing order of commercial implementation cost and technical complexity.
Figure 1. Cumulative coverage of issues by remote care solutions when plotted in increasing order of implementation cost/complexity. The solutions up to the dashed vertical line denotes the feature set selected for Remote Assist. Abbreviations: MVBT = Master volume, bass and treble; T = Threshold; AutoNRT = Automatic neural response telemetry; ENT = Ear Nose and throat.
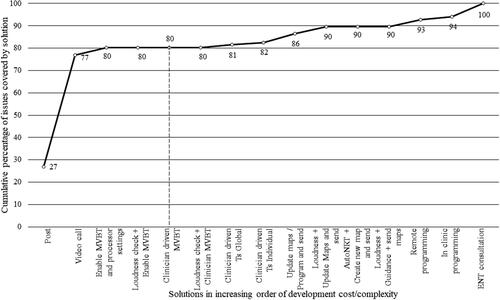
Table 2. Demographic details of participants in the clinical evaluation phase.
Figure 2. Participant rating to the question “How well you felt you understood what they were saying to you?”. Black: Face-to-face conversation, White: Video call with Remote Assist (RA), Horizontal hatching: Audio call with RA, Grey: Video call with Voice over Internet Protocol (VoIP), and Checked hatchings: Audio call with VoIP. Box plots display quartiles and data range. Mean values are denoted by ‘x’, and ‘*’ denotes a significant difference (p < 0.05).
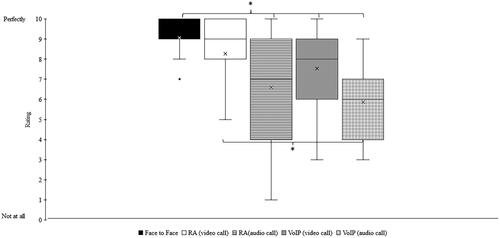
Figure 3. Speech perception scores with City University of New York (CUNY) sentences during VoIP video call and RA. * show significant differences (p < 0.05).
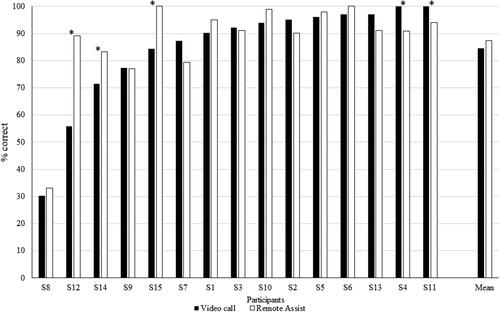
Figure 4. Time taken for the software to make changes over the Internet (system latency) and time taken for the participant to respond (recipient response). Mean values are denoted by ‘x’.
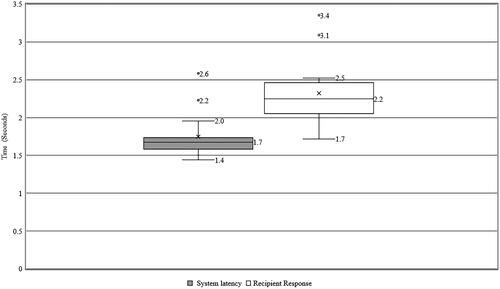
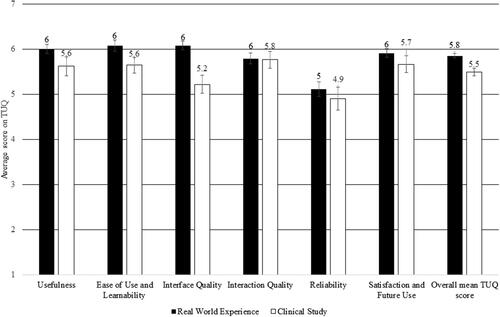
Figure 5. Participant ratings on Telehealth Usability Questionnaire (TUQ) for Remote Assist during the clinical study (N = 15) and the real-world experience (N = 57). Error bars indicate standard error.