Figures & data
Figure 1. The publication output in 1999–2018
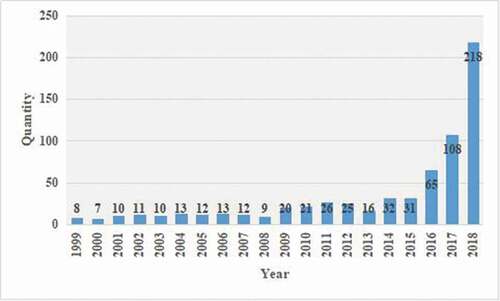
Figure 2. Time trend over average number of authors
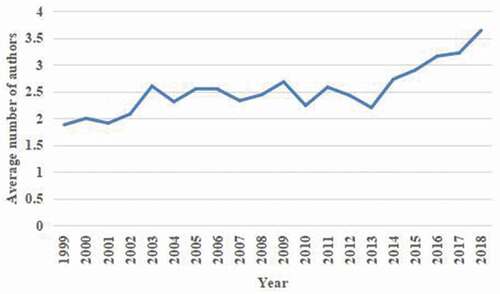
Table 1. Top 10 frequently journals
Table 2. Top 6 articles of high citation frequency
Table 3. Top 10 productive countries
Figure 3. The network of countries
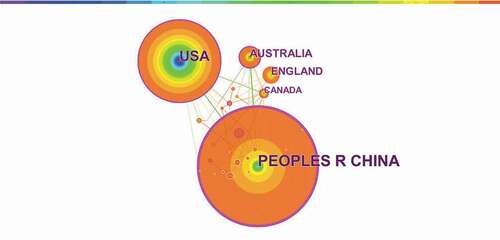
Table 4. Top 5 productive institutions
Figure 4. The network of institutions
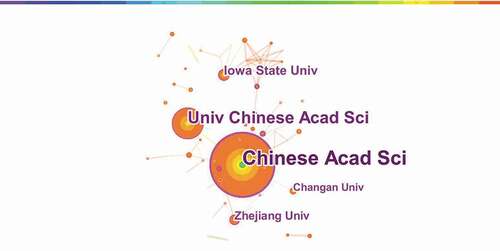
Table 5. Top 5 productive authors
Table 6. Top 10 wos categories
Figure 5. The main research domains map
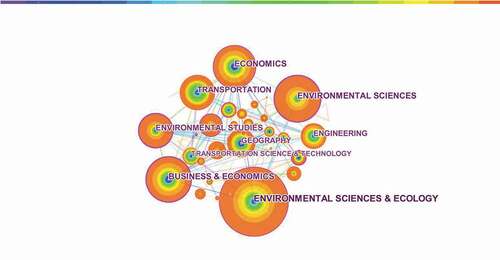
Table 7. Top 10 frequently cited journals
Figure 6. Cited journal network
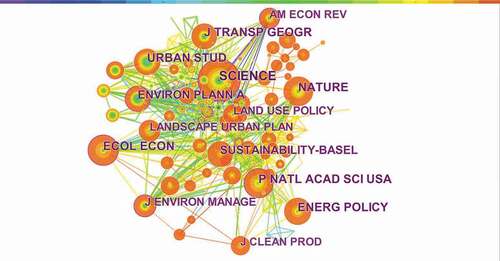
Figure 7. Cited reference map
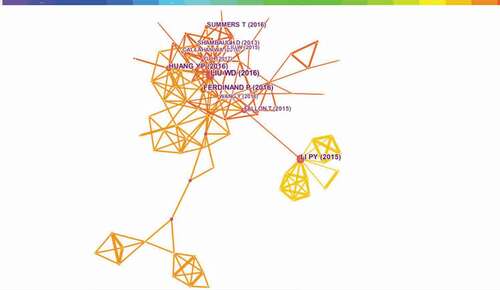
Table 8. Ranking of high frequently cited reference
Figure 8. Keyword cluster map
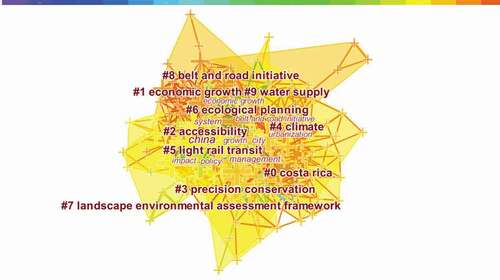
Table 9. The detailed information of clusters
Table 10. Ranking of high frequency keywords
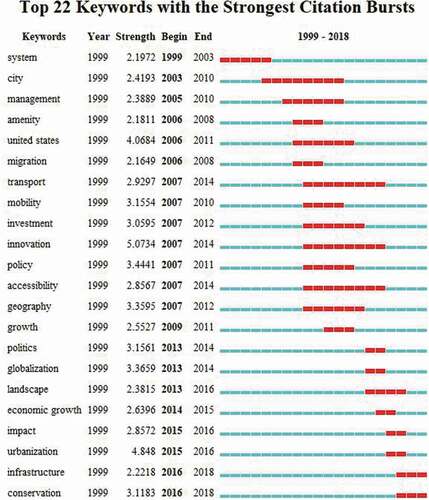
Figure 9. Top 22 keywords with the strongest citation bursts