Figures & data
Figure 1. Case 1: Upper chart: Plasma glucose levels of a 51-year old male with Type 2 diabetes exposed to different levels of power quality. Insert shows the entire data set with one very high plasma glucose reading that was recorded during a period of high exposure to dirty electricity. Lower chart: Three years later, fasting plasma glucose levels correspond to power quality measured in GS units. Time spent in front of computer resulted in higher plasma glucose levels that dropped 1.1 mmol/L [19.8 mg/dL] 10 min after moving away from computer. Note that we have scaled both plots the say way in .
![Figure 1. Case 1: Upper chart: Plasma glucose levels of a 51-year old male with Type 2 diabetes exposed to different levels of power quality. Insert shows the entire data set with one very high plasma glucose reading that was recorded during a period of high exposure to dirty electricity. Lower chart: Three years later, fasting plasma glucose levels correspond to power quality measured in GS units. Time spent in front of computer resulted in higher plasma glucose levels that dropped 1.1 mmol/L [19.8 mg/dL] 10 min after moving away from computer. Note that we have scaled both plots the say way in Fig. 1.](/cms/asset/8ef21ad0-495b-41b6-9628-b9d9f73bb0dd/iebm_a_307373_uf0001_b.jpg)
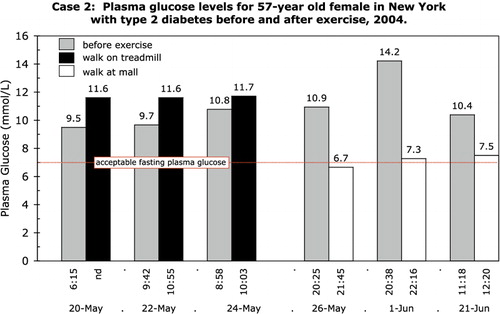
Figure 2.Case 2: Plasma glucose levels for a 57-year old female in New York with Type 2 diabetes, before and after walking for 20–30 min on a treadmill in her home and after hours at a mall.
Case 3: Plasma glucose levels and daily insulin injections (Humulin® 70/30) for an 80-year old woman with Type 1 diabetes before and while GS filters were installed in her home in Arizona
Figure 3.Case 4: Sequence of mean daily plasma glucose levels and total daily insulin injections for 12-year old male with Type 1 diabetes who was admitted to hospital in December 2002 and returned home on January 1, 2003. On January 14, 2003, GS filters were installed in his home to improve power quality.
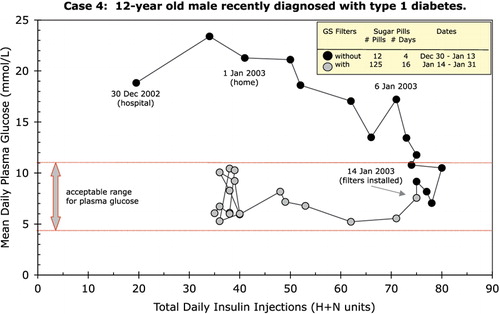
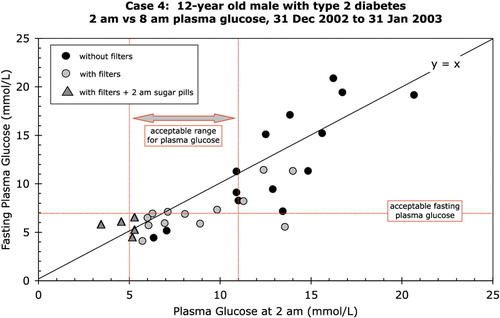
Figure 4. Case 4: Fasting (8 am) and 2 am plasma glucose levels for 12-year old male with Type 1 diabetes with and without GS filters. NOTE: Sugar pills were administered at 2 am for 5 d to prevent hypoglycemia while filters were installed.