611
Views
5
CrossRef citations to date
0
Altmetric
Research Article

The Influence of L-Carnitine on Oxidative Modification of LDL In Vitro

, &
Pages 455-462 | Received 16 Jun 2007, Accepted 03 Aug 2007, Published online: 09 Oct 2008

Figures & data

FIGURE 1 The influence of L-carnitine on the content of conjugated dienes in native and oxidized LDL (n = 6). Statistically significant differences for p <0.05: 1 h: 1–2; 2–4; 3–4, 2 h: 1–2,3; 2–4; 3–4, 4 h: 1–2,3; 2–4; 3–4, 6 h: 1–2,3; 2–4; 3–4, 18 h: 1–2,3,4; 2–4; 3–4
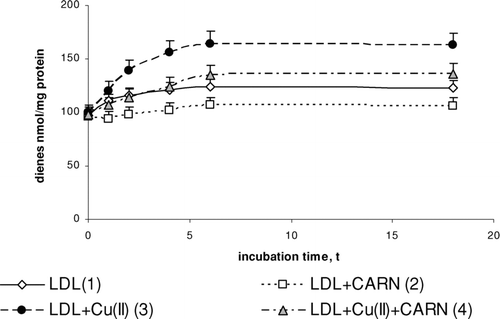
FIGURE 1 The influence of L-carnitine on the content of conjugated dienes in native and oxidized LDL (n = 6). Statistically significant differences for p <0.05: 1 h: 1–2; 2–4; 3–4, 2 h: 1–2,3; 2–4; 3–4, 4 h: 1–2,3; 2–4; 3–4, 6 h: 1–2,3; 2–4; 3–4, 18 h: 1–2,3,4; 2–4; 3–4

FIGURE 2 The influence of L-carnitine on the content of lipid hydroperoxides in native and oxidized LDL (n = 6). Statistically significant differences for p <0.05: 1 h: 1–3; 2–4; 3–4, 2 h: 1–2,3; 2–4; 3–4, 4 h: 1–2,3; 2–4; 3–4, 6 h: 1–2,3;4 2–4; 3–4, 18 h: 1–2,3;4 2–4; 3–4.
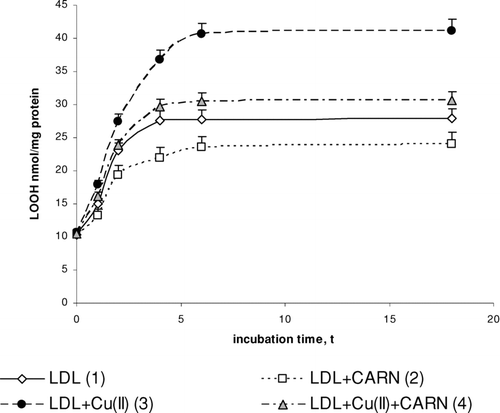
FIGURE 2 The influence of L-carnitine on the content of lipid hydroperoxides in native and oxidized LDL (n = 6). Statistically significant differences for p <0.05: 1 h: 1–3; 2–4; 3–4, 2 h: 1–2,3; 2–4; 3–4, 4 h: 1–2,3; 2–4; 3–4, 6 h: 1–2,3;4 2–4; 3–4, 18 h: 1–2,3;4 2–4; 3–4.

FIGURE 3 The influence of L-carnitine on the content of malondialdehyde in native and oxidized LDL (n = 6). Statistically significant differences for p <0.05: 1 h: 1–3,4; 2–4; 3–4, 2 h: 1–2,3,4; 2–4; 3–4, 4 h: 1–2,3,4; 2–4; 3–4, 6 h: 1–2,3,4; 2–4; 3–4, 18 h: 1–2,3,4; 2–4; 3–4.
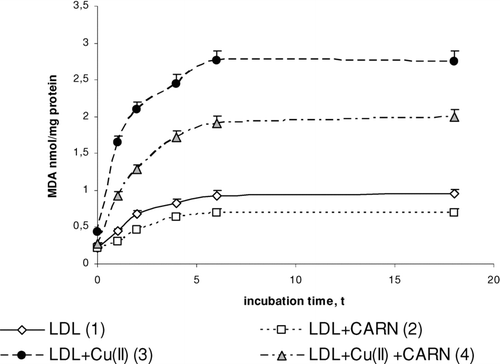
FIGURE 3 The influence of L-carnitine on the content of malondialdehyde in native and oxidized LDL (n = 6). Statistically significant differences for p <0.05: 1 h: 1–3,4; 2–4; 3–4, 2 h: 1–2,3,4; 2–4; 3–4, 4 h: 1–2,3,4; 2–4; 3–4, 6 h: 1–2,3,4; 2–4; 3–4, 18 h: 1–2,3,4; 2–4; 3–4.

FIGURE 4 The influence of L-carnitine on the content of dityrosine in native and oxidized LDL (n = 6). Statistically significant differences for p <0.05: 1 h: 1–2,3,4; 2–4; 3–4, 2 h: 1–2,3; 2–4; 3–4, 4 h: 1–2,3,4; 2–4; 3–4, 6 h: 1–2,3,4; 2–4; 3–4, 18 h: 1–2,3,4; 2–4; 3–4.
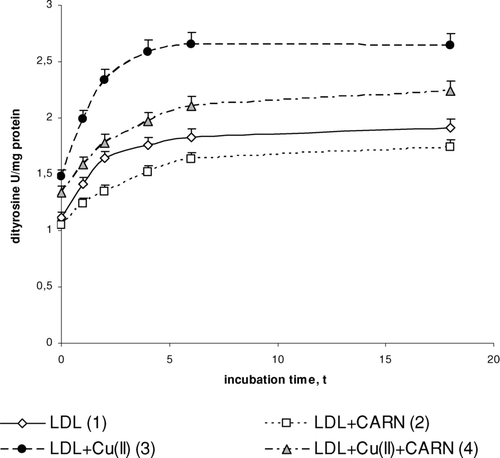
FIGURE 4 The influence of L-carnitine on the content of dityrosine in native and oxidized LDL (n = 6). Statistically significant differences for p <0.05: 1 h: 1–2,3,4; 2–4; 3–4, 2 h: 1–2,3; 2–4; 3–4, 4 h: 1–2,3,4; 2–4; 3–4, 6 h: 1–2,3,4; 2–4; 3–4, 18 h: 1–2,3,4; 2–4; 3–4.
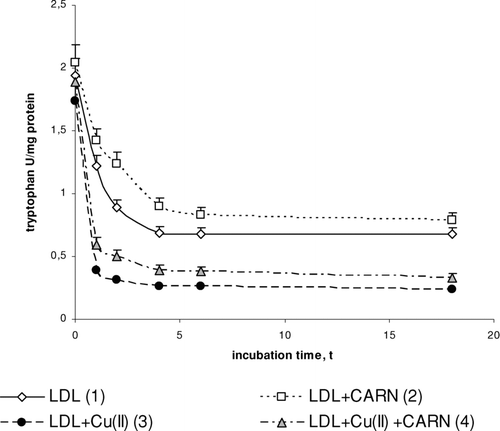
FIGURE 5 The influence of L-carnitine on the content of tryptophan in native and oxidized LDL (n = 6). Statistically significant differences for p <0.05: 1 h: 1–2,3,4; 2–4; 3–4, 2 h: 1–2,3,4; 2–4; 3–4, 4 h: 1–2,3,4; 2–4 3–4, 6 h: 1–2,3,4; 2–4; 3–4, 18 h: 1–3,4; 2–4.

FIGURE 5 The influence of L-carnitine on the content of tryptophan in native and oxidized LDL (n = 6). Statistically significant differences for p <0.05: 1 h: 1–2,3,4; 2–4; 3–4, 2 h: 1–2,3,4; 2–4; 3–4, 4 h: 1–2,3,4; 2–4 3–4, 6 h: 1–2,3,4; 2–4; 3–4, 18 h: 1–3,4; 2–4.

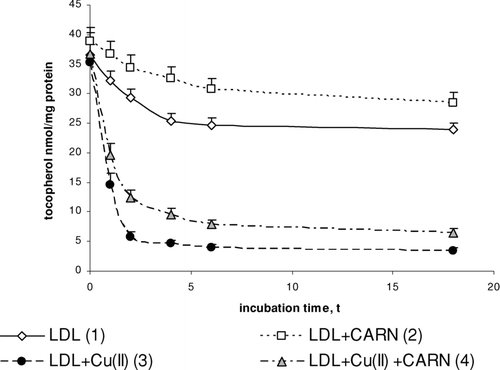
FIGURE 6 The influence of L-carnitine on the content of α-tocopherol in native and oxidized LDL (n = 6). Statistically significant differences for p <0.05: 1 h: 1–2,3,4; 2–4; 3–4, 2 h: 1–2,3,4; 2–4; 3–4, 4 h: 1–2,3,4; 2–4; 3–4, 6 h: 1–2,3,4; 2–4; 3–4, 18 h: 1–2,3,4; 2–4; 3–4

FIGURE 6 The influence of L-carnitine on the content of α-tocopherol in native and oxidized LDL (n = 6). Statistically significant differences for p <0.05: 1 h: 1–2,3,4; 2–4; 3–4, 2 h: 1–2,3,4; 2–4; 3–4, 4 h: 1–2,3,4; 2–4; 3–4, 6 h: 1–2,3,4; 2–4; 3–4, 18 h: 1–2,3,4; 2–4; 3–4