Figures & data
Figure 1. Percentage of adverts with either party leader present.
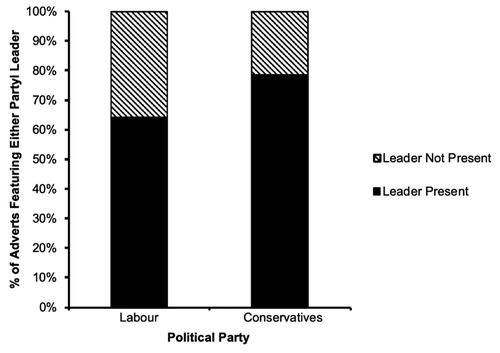
Figure 2. Percentage of adverts with either party leader present across the three phases of the election.
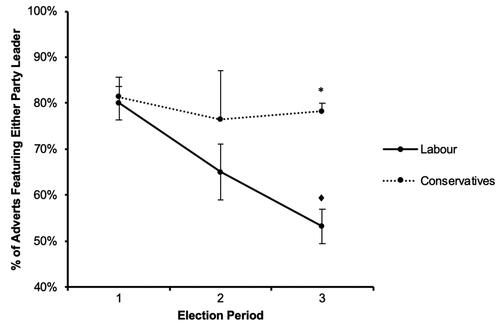
Figure 3. Percentage of adverts with own leader present.
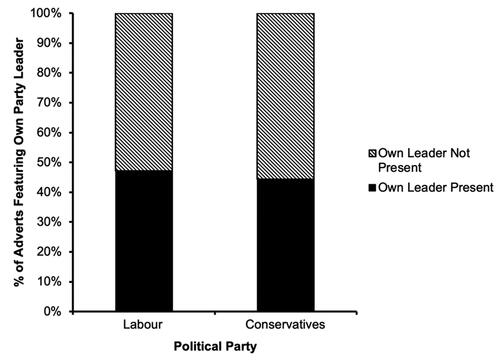
Figure 4. Percentage of adverts with own leader present across the three phases of the election.
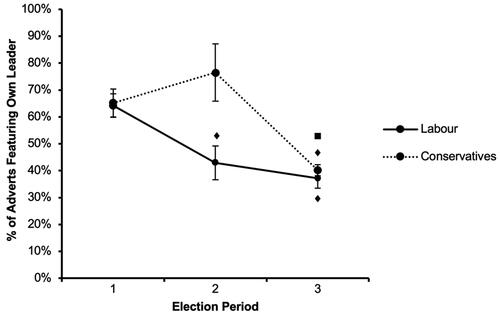
Figure 5. Percentage of adverts with opponent leader present.
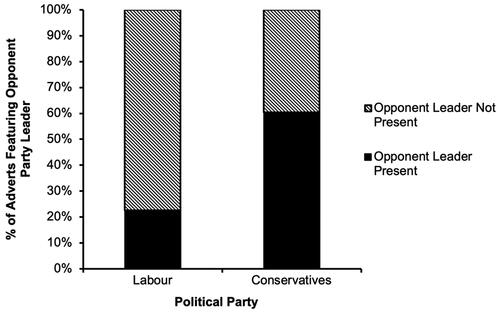
Figure 6. Percentage of adverts with opponent leader present across the three phases of the election.
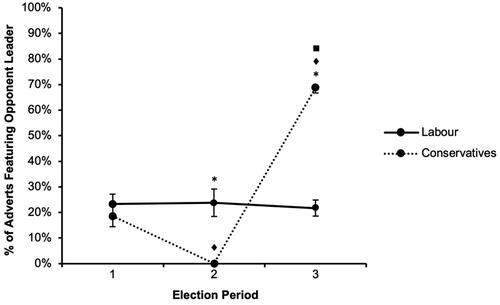
Figure 7. Percentage of adverts using own party branding.
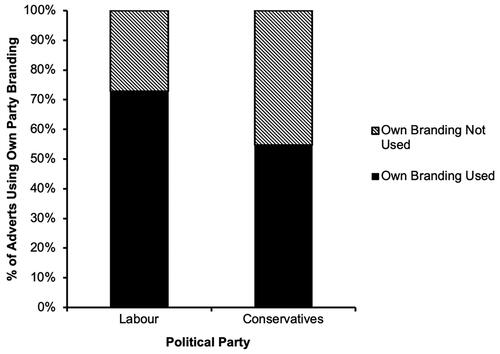
Figure 8. Percentage of adverts using own branding across the three phases of the election.
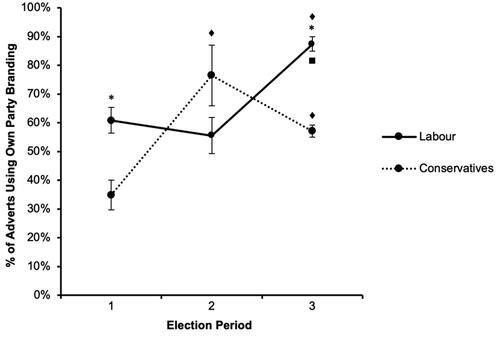
Figure 9. Percentage of adverts using opponent party branding.
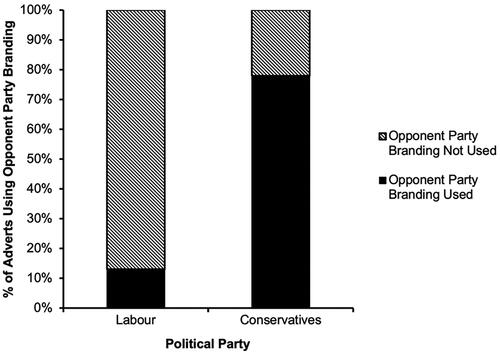
Figure 10. Percentage of adverts using opponent party branding across the three phases of the election.
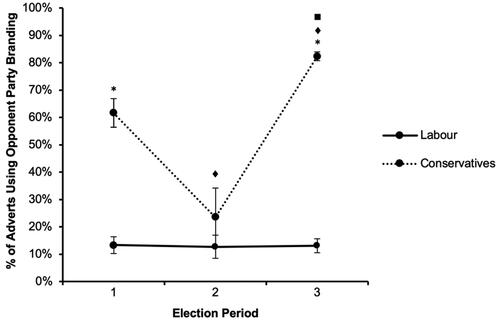
Figure 11. Advert targeting towards each age group.
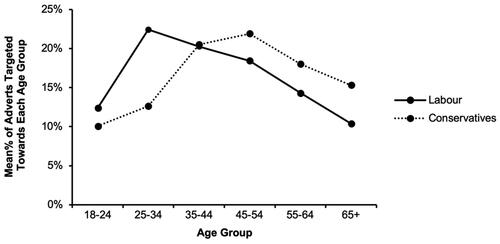
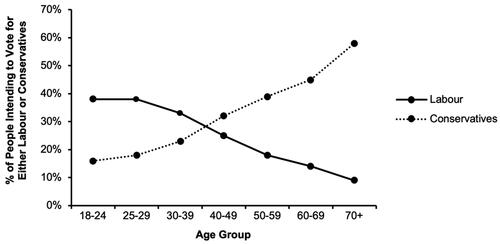
Figure 12. Voting intention by age group from 2019 YouGov survey.