833
Views
5
CrossRef citations to date
0
Altmetric
Research Paper

STK33 potentiates the malignancy of hypopharyngeal squamous carcinoma: Possible relation to calcium

, , , , , , , & show all
Pages 976-984 | Received 11 Apr 2016, Accepted 03 Jul 2016, Published online: 11 Aug 2016

Figures & data

Table 1. Primer, amplicon size and annealing temperature of each gene for qRT-PCR and PCR.

Figure 1. Effects of STK33 on tumor growth in vivo. (A) Infection of STK33-RNAi into Fadu cells led to a significant decrease in STK33 mRNA expression compared with that in the normal Fadu cells. Data represent the mean ± SEM , *p < 0 .05. (B) Gross appearance of tumor-bearing nude mice and the excised tumor specimens at the end of the treatment. Photographs of animals and tumors were representative from each group. a) control group, b) mock group, c) STK33-RNAi group. (C) Tumor volume and formation time of STK33-RNAi cells derived xenografts differed from those of normal and mock cells. STK33-RNAi markedly decreased the volume of the tumor and delayed the formation of the tumor. Data represent the mean ± SEM, *p < 0 .05. (D) Representative images of STK33 IHC staining and correspondingly quantitative analysis in the 3 groups. STK33-RNAi significantly decreased the STK33 expression in the tumor tissue. Data represent the mean ± SEM, *p < 0 .05. (E) Microscopic view of tumor metastasis by HE staining. a) control group, b) STK33-RNAi group.
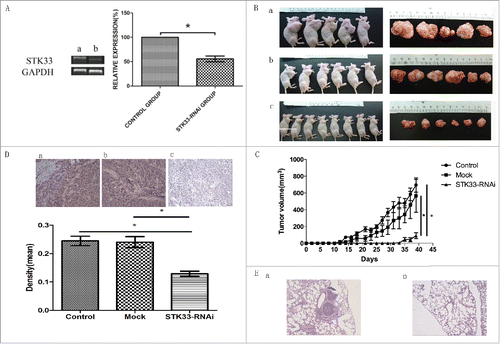
Figure 1. Effects of STK33 on tumor growth in vivo. (A) Infection of STK33-RNAi into Fadu cells led to a significant decrease in STK33 mRNA expression compared with that in the normal Fadu cells. Data represent the mean ± SEM , *p < 0 .05. (B) Gross appearance of tumor-bearing nude mice and the excised tumor specimens at the end of the treatment. Photographs of animals and tumors were representative from each group. a) control group, b) mock group, c) STK33-RNAi group. (C) Tumor volume and formation time of STK33-RNAi cells derived xenografts differed from those of normal and mock cells. STK33-RNAi markedly decreased the volume of the tumor and delayed the formation of the tumor. Data represent the mean ± SEM, *p < 0 .05. (D) Representative images of STK33 IHC staining and correspondingly quantitative analysis in the 3 groups. STK33-RNAi significantly decreased the STK33 expression in the tumor tissue. Data represent the mean ± SEM, *p < 0 .05. (E) Microscopic view of tumor metastasis by HE staining. a) control group, b) STK33-RNAi group.

Figure 2. Differential gene expression values in Fadu cells upon STK33-RNAi. (A) Composite hierarchical and conditional clustering of statistically significant alterations in gene expression from Fadu and STK33-RNAi Fadu cells. Gene expression levels are shown by red for high and green for low expressing genes. (B) Volcano plot showing an overview of gene expression in Fadu and STK33-RNAi Fadu cells. Each dot represented the mean regulation value (log2-fold change of STK33-RNAi versus control cells) of 3 replicas and the p-value(-log10 of p-values). x-axis: Log2(Fold change), y-axis: -log10(p-value). Negative values indicated a decrease and positive values showed an increase in gene expression upon fusion gene knockdown. Red Region: p-value<0 .05, Fold Change≥2 . (C) Changes of selected gene in microarray. (D) STK33-RNAi infection led to a significant decrease in CAPN1 mRNA expression compared with that in the normal Fadu cells. a) control group, b) STK33-RNAi group. (E) Data represent the mean± SEM, *p < 0 .05.
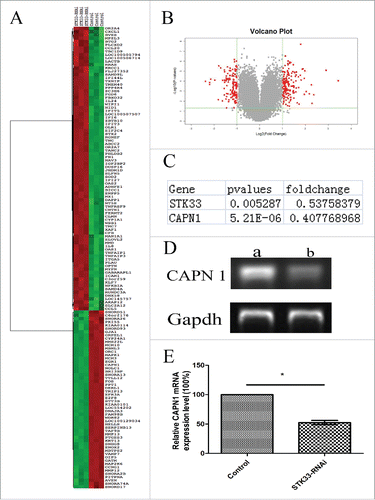
Figure 2. Differential gene expression values in Fadu cells upon STK33-RNAi. (A) Composite hierarchical and conditional clustering of statistically significant alterations in gene expression from Fadu and STK33-RNAi Fadu cells. Gene expression levels are shown by red for high and green for low expressing genes. (B) Volcano plot showing an overview of gene expression in Fadu and STK33-RNAi Fadu cells. Each dot represented the mean regulation value (log2-fold change of STK33-RNAi versus control cells) of 3 replicas and the p-value(-log10 of p-values). x-axis: Log2(Fold change), y-axis: -log10(p-value). Negative values indicated a decrease and positive values showed an increase in gene expression upon fusion gene knockdown. Red Region: p-value<0 .05, Fold Change≥2 . (C) Changes of selected gene in microarray. (D) STK33-RNAi infection led to a significant decrease in CAPN1 mRNA expression compared with that in the normal Fadu cells. a) control group, b) STK33-RNAi group. (E) Data represent the mean± SEM, *p < 0 .05.

Figure 3. The changes of [Ca2+]i in the cells with Ionomycin treatment. (A) Fluorescence intensity increased after treated with Ionomycin. (B) Mean fluorescence intensity of the cells represents the [Ca2+]i.

Figure 3. The changes of [Ca2+]i in the cells with Ionomycin treatment. (A) Fluorescence intensity increased after treated with Ionomycin. (B) Mean fluorescence intensity of the cells represents the [Ca2+]i.

Figure 4. Effects of STK33-RNAi and Ionomycin on Fadu cells and in vitro cell function test. (A) Induction of apoptosis in Fadu cells by Ionomycin as assessed by AO staining. a) control, b) treated with Ionomycin for 6h. (B) Decrease in cell viability by Ionomycin appeared in time-manner. STK33-RNAi group had higher cell viability than the control group. Data represent the mean ± SEM, *p < 0 .05.
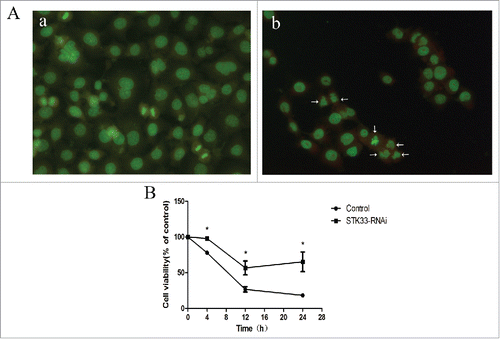
Figure 4. Effects of STK33-RNAi and Ionomycin on Fadu cells and in vitro cell function test. (A) Induction of apoptosis in Fadu cells by Ionomycin as assessed by AO staining. a) control, b) treated with Ionomycin for 6h. (B) Decrease in cell viability by Ionomycin appeared in time-manner. STK33-RNAi group had higher cell viability than the control group. Data represent the mean ± SEM, *p < 0 .05.

Figure 5. Effect of Ionomycin in Fadu cells on STK33 protein expression. (A) Representative protein gel blots showed the alterations in protein expressions of STK33 in the cells after exposure to 1.5 μM Ionomycin for 0 h, 1 h, 2 h, 4 h, 6 h and 24 h. (B) Graphs show the mean ± SEM after normalization to β-Actin protein. Results shown as means ± SEM, *p < 0 .05.

Figure 5. Effect of Ionomycin in Fadu cells on STK33 protein expression. (A) Representative protein gel blots showed the alterations in protein expressions of STK33 in the cells after exposure to 1.5 μM Ionomycin for 0 h, 1 h, 2 h, 4 h, 6 h and 24 h. (B) Graphs show the mean ± SEM after normalization to β-Actin protein. Results shown as means ± SEM, *p < 0 .05.

Figure 6. Effect of Ionomycin in Fadu cells on CAPN1 mRNA expression. (A) Quantification of mRNA expressions of CAPN1 in the Fadu cells treated with 1.5 μM Ionomycin for 0 h, 1 h, 2 h, 4 h, 6 h and 24 h qRT-PCR. Results shown as means ± SEM, *p < 0 .05. (B) Quantification of mRNA expressions of CAPN1 in the STK33-RNAi Fadu cells treated with Ionomycin by qRT-PCR. Results shown as means ± SEM, *p < 0 .05.
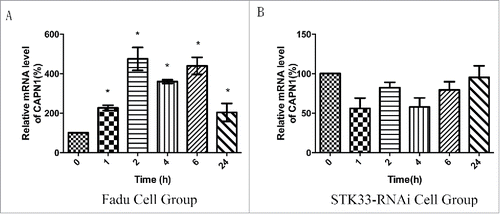
Figure 6. Effect of Ionomycin in Fadu cells on CAPN1 mRNA expression. (A) Quantification of mRNA expressions of CAPN1 in the Fadu cells treated with 1.5 μM Ionomycin for 0 h, 1 h, 2 h, 4 h, 6 h and 24 h qRT-PCR. Results shown as means ± SEM, *p < 0 .05. (B) Quantification of mRNA expressions of CAPN1 in the STK33-RNAi Fadu cells treated with Ionomycin by qRT-PCR. Results shown as means ± SEM, *p < 0 .05.

Reprints and Corporate Permissions

Please note: Selecting permissions does not provide access to the full text of the article, please see our help page How do I view content?

To request a reprint or corporate permissions for this article, please click on the relevant link below:

Academic Permissions

Please note: Selecting permissions does not provide access to the full text of the article, please see our help page How do I view content?

Obtain permissions instantly via Rightslink by clicking on the button below:

If you are unable to obtain permissions via Rightslink, please complete and submit this Permissions form. For more information, please visit our Permissions help page.