1,665
Views
2
CrossRef citations to date
0
Altmetric
Research Papers

Long noncoding RNA LINP1 acts as an oncogene and promotes chemoresistance in breast cancer

, , , , , , , , , , , & show all
Pages 120-131 | Received 30 Jun 2017, Accepted 15 Oct 2017, Published online: 02 Jan 2018

Figures & data

Figure 1. LINP1 knockdown inhibited proliferation and induced apoptosis in breast cancer cells. (A) MDA-MB-231 (right), MDA-MB-468 (middle) and MCF-7 (left) cells were transfected with NC (negative control) or LINP1 siRNAs to inhibit the expression of LINP1. (B) MTT assays were used to determine the cell viability of siLINP1-transfected MDA-MB-231 (right), MDA-MB-468 (middle) and MCF-7 (left) cells. Experiments were performed in triplicate. (C) Flow cytometry was performed to determine the effect of LINP1 on changes in cell cycle distribution (right). Statistical diagrams show significant differences (middle). Western blotting was used to detect cyclin D1, cyclin D3, and CDK4 expression (left). (D) LINP1 knockdown promoted apoptosis in MDA-MB-231 and MDA-MB-468 cells, *P < 0.05, **P < 0.01, and, ***P < 0.001 by the Student's t test.
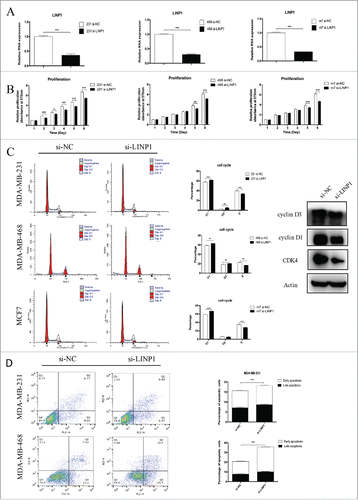
Figure 1. LINP1 knockdown inhibited proliferation and induced apoptosis in breast cancer cells. (A) MDA-MB-231 (right), MDA-MB-468 (middle) and MCF-7 (left) cells were transfected with NC (negative control) or LINP1 siRNAs to inhibit the expression of LINP1. (B) MTT assays were used to determine the cell viability of siLINP1-transfected MDA-MB-231 (right), MDA-MB-468 (middle) and MCF-7 (left) cells. Experiments were performed in triplicate. (C) Flow cytometry was performed to determine the effect of LINP1 on changes in cell cycle distribution (right). Statistical diagrams show significant differences (middle). Western blotting was used to detect cyclin D1, cyclin D3, and CDK4 expression (left). (D) LINP1 knockdown promoted apoptosis in MDA-MB-231 and MDA-MB-468 cells, *P < 0.05, **P < 0.01, and, ***P < 0.001 by the Student's t test.

Figure 2. LINP1 knockdown inhibited migration and invasion in breast cancer cells. (A) Wound healing assays and (B) Transwell migration assays demonstrated that LINP1 knockdown inhibited cell migration. The columns are the average of three independent experiments. (C) Transwell invasion assays were used to measure the impaired invasion capacities of MDA-MB-231 cells. The columns are the average of three independent experiments. (D) LINP1 knockdown led to increased E-cadherin expression and decreased N-cadherin and vimentin expression. (E) LINP1 expression levels were measured in six breast cancer cell lines with quantitative real-time PCR (qPCR). Actin was used as the endogenous control. (F) MDA-MB-231 cells were transfected with flag-p53; then the efficacy (right) and effect on LINP1 expression (left) were evaluated by qPCR. (G) P53 was knockdown via transfection with shp53 in MCF-7 cells. Then, the efficacy (right) and effect on LINP1 expression (left) were evaluated by qPCR. (H) LINP1 overexpression did not influence p53 expression in MDA-MB-231 cells. (I) P53 overexpression inhibited MDA-MB-231 cell migration and LINP1 could attenuate this effect. The columns are the average of three independent experiments, *P < 0.05, **P < 0.01, and, ***P < 0.001 by the Student's t test.
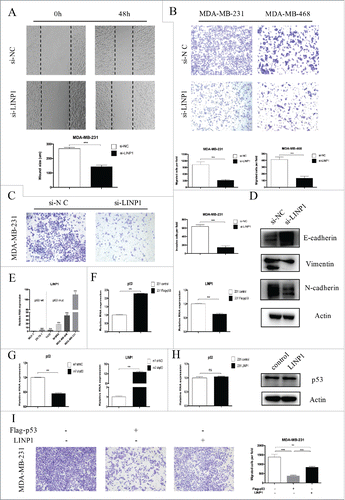
Figure 2. LINP1 knockdown inhibited migration and invasion in breast cancer cells. (A) Wound healing assays and (B) Transwell migration assays demonstrated that LINP1 knockdown inhibited cell migration. The columns are the average of three independent experiments. (C) Transwell invasion assays were used to measure the impaired invasion capacities of MDA-MB-231 cells. The columns are the average of three independent experiments. (D) LINP1 knockdown led to increased E-cadherin expression and decreased N-cadherin and vimentin expression. (E) LINP1 expression levels were measured in six breast cancer cell lines with quantitative real-time PCR (qPCR). Actin was used as the endogenous control. (F) MDA-MB-231 cells were transfected with flag-p53; then the efficacy (right) and effect on LINP1 expression (left) were evaluated by qPCR. (G) P53 was knockdown via transfection with shp53 in MCF-7 cells. Then, the efficacy (right) and effect on LINP1 expression (left) were evaluated by qPCR. (H) LINP1 overexpression did not influence p53 expression in MDA-MB-231 cells. (I) P53 overexpression inhibited MDA-MB-231 cell migration and LINP1 could attenuate this effect. The columns are the average of three independent experiments, *P < 0.05, **P < 0.01, and, ***P < 0.001 by the Student's t test.

Figure 3. LINP1 contributes to multidrug resistance in breast cancer cells. (A) The IC50 values of MDA-MB-231/5FU (upper) and MDA-MB-231/DOX (down) cells was higher than that of their parental cells. (B) qPCR analysis showed that LINP1 expression levels were higher in MDA-MB-231/5FU (left) and MDA-MB-231/DOX (right) cell lines compared with their parental cell lines. (C and D) LINP1 knockdown inhibited drug-resistant cell proliferation and migration. The columns are the average of three independent experiments. (E) MTT assays indicated that LINP1 knockdown in drug-resistant cells decreased cell viability under the stress of 5FU or DOX. (F) 30 μg/ml 5FU or 0.4 μg/ml DOX was used to test the inhibition. of drug-resistance caused by LINP1 knockdown in MDA-MB-231/5FU (left) and MDA-MB-231/DOX (right) cells, respectively. (G) MTT assays indicated that LINP1 overexpression in MDA-MB-231 cells increased resistance to both 5FU and DOX. (H) 30 μg/ml 5FU or 0.4 μg/ml DOX was used to test the promotion of drug-resistance caused by LINP1 overexpression in MDA-MB-231 cell lines, *P < 0.05, **P < 0.01, and, ***P < 0.001 by the Student's t test.
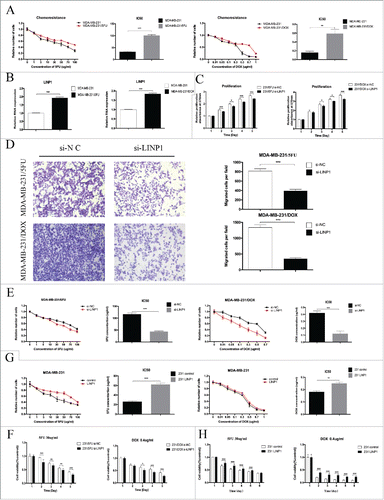
Figure 3. LINP1 contributes to multidrug resistance in breast cancer cells. (A) The IC50 values of MDA-MB-231/5FU (upper) and MDA-MB-231/DOX (down) cells was higher than that of their parental cells. (B) qPCR analysis showed that LINP1 expression levels were higher in MDA-MB-231/5FU (left) and MDA-MB-231/DOX (right) cell lines compared with their parental cell lines. (C and D) LINP1 knockdown inhibited drug-resistant cell proliferation and migration. The columns are the average of three independent experiments. (E) MTT assays indicated that LINP1 knockdown in drug-resistant cells decreased cell viability under the stress of 5FU or DOX. (F) 30 μg/ml 5FU or 0.4 μg/ml DOX was used to test the inhibition. of drug-resistance caused by LINP1 knockdown in MDA-MB-231/5FU (left) and MDA-MB-231/DOX (right) cells, respectively. (G) MTT assays indicated that LINP1 overexpression in MDA-MB-231 cells increased resistance to both 5FU and DOX. (H) 30 μg/ml 5FU or 0.4 μg/ml DOX was used to test the promotion of drug-resistance caused by LINP1 overexpression in MDA-MB-231 cell lines, *P < 0.05, **P < 0.01, and, ***P < 0.001 by the Student's t test.

Figure 4. LINP1 protected breast cancer cells from chemotherapeutic-induced apoptosis. (A and B) MDA-MB-468 cells were transiently transfected with LINP1 overexpression plasmid or control plasmid, followed by 5FU or DOX treatment. The apoptosis rates were determined by FACS analysis. Representative results are shown, and the data are presented as the mean ± SD. (C) Western blot analysis was performed to detect the effects of LINP1 overexpression on the protein levels of apoptosis-related proteins with or without drug treatment. Actin served as a loading control for Western blots, *P<0.05, **P<0.01, and, ***P<0.001 by the Student's t test.
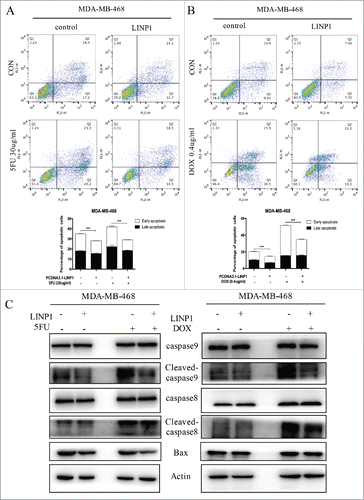
Figure 4. LINP1 protected breast cancer cells from chemotherapeutic-induced apoptosis. (A and B) MDA-MB-468 cells were transiently transfected with LINP1 overexpression plasmid or control plasmid, followed by 5FU or DOX treatment. The apoptosis rates were determined by FACS analysis. Representative results are shown, and the data are presented as the mean ± SD. (C) Western blot analysis was performed to detect the effects of LINP1 overexpression on the protein levels of apoptosis-related proteins with or without drug treatment. Actin served as a loading control for Western blots, *P<0.05, **P<0.01, and, ***P<0.001 by the Student's t test.

Table 1. Associations between patient characteristics and LINP1 expression.

Table 2. Influence of LINP1 expression and different clinicopathological parameters on overall survival for breast cancer patients.

Figure 5. LINP1 was an unfavorable prognostic marker in breast cancer. Kaplan-Meier analysis for (A) overall survival and (B) disease-free survival in 67 breast cancer tissue donors stratified for low and high relative LINP1 expression. (C) LINP1 expression in primary breast cancers with or without distant metastasis. Actin was used as an endogenous control.
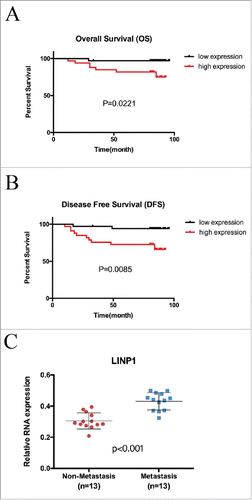
Figure 5. LINP1 was an unfavorable prognostic marker in breast cancer. Kaplan-Meier analysis for (A) overall survival and (B) disease-free survival in 67 breast cancer tissue donors stratified for low and high relative LINP1 expression. (C) LINP1 expression in primary breast cancers with or without distant metastasis. Actin was used as an endogenous control.

Table 3. Cox proportional hazard multivariate analysis: Influence of HOTAIR tumor levels and positive lymph nodes on overall survival for breast cancer patients.

Supplemental material

New_folder__2_.zip

Download Zip (4.5 MB)

Reprints and Corporate Permissions

Please note: Selecting permissions does not provide access to the full text of the article, please see our help page How do I view content?

To request a reprint or corporate permissions for this article, please click on the relevant link below:

Academic Permissions

Please note: Selecting permissions does not provide access to the full text of the article, please see our help page How do I view content?

Obtain permissions instantly via Rightslink by clicking on the button below:

If you are unable to obtain permissions via Rightslink, please complete and submit this Permissions form. For more information, please visit our Permissions help page.