Figures & data
Table 1. ALK inhibitors synergize with EGFR inhibitors in inhibitor assays in HNSCC patient-derived tumor cells. HNSCC patient-derived tumor cells (within 0 to 2 passages) from 8 patients were screened by inhibitor assays. Patient-derived tumor cells were plated in 384-well-plates containing 122 drugs in seven serial dilutions with or without 50 nM of EGFR inhibitor. MTS cell proliferation assay was used to determine the IC50s of the drugs on the panel as single agents or in combination with EGFR inhibitors. IC50s of ALK inhibitors TAE684 and GSK1838705A as single agents (A) or in combination with 50nM gefitinib (B), as well as IC50s of three EGFR inhibitors as single agents (C) are shown. Effective drugs for an individual patient are defined as the drugs that have IC50s below 20% of median IC50.
Figure 1. Validation of EGFR and ALK inhibitor combinations in patient-derived tumor cells. Patient-derived tumor cells from patients 10004, 10054, 10058, 10139, 10159 and 10250 were treated with a dose gradient of gefitinib, ALK inhibitors including ceritinib (A), brigatinib (B), GSK1838705A (C) and TAE684 (D) or their combinations (A–D). After 72 hours, cell viability was assessed using a MTS assay and normalized to vehicle treated cells. Patient numbers are sorted based on the IC50s for each EGFR/ALK drug combination from low to high. Dotted lines in (A) and (B) indicate maxima plasma concentration in patients of the total concentration of the two drugs in patients. No information regarding maxima plasma concentration in patients for GSK1838705A (C) and TAE684 (D) was available. Data represents the mean ± SD between three independent experiments (n = 3). Combination treatment groups were compared to single agent groups by one-way ANOVA and Dunnett multiple comparison test.
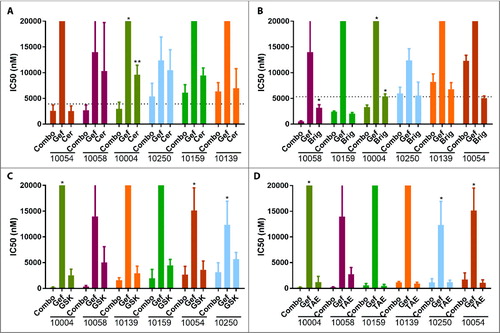
Figure 2. Synergy between siALK and gefitinib in HNSCC patient-derived tumor cells. Patient-derived tumor cells from patients indicated were transfected with siRNA pools individually targeting each member of the receptor tyrosine kinome in addition to NRAS and KRAS co-treated with vehicle (A, C, E, and G) or with 50nM gefitinib (B, D, F, and H). Cell viability was calculated by normalizing absorbance at 490 nM (as determined by the MTS assay) to the median plate value after 96 hours of treatment. Dotted lines indicate mean ± 2SD. Effective siRNAs are defined as those that inhibit cell viability 2SD below the mean-of all siRNAs and were statistically different from the non-specific siRNA controls. Error bar represents the mean ± SEM, each containing three replicates (n = 3).
Figure 3. Co-targeting EGFR and ALK decreases HNSCC patient's tumor cell number, cell colony formation ability and increases cell apoptosis in patient 10004 derived tumor cells. A, Patient 10004 derived tumor cells were treated with 1 μM gefitinib, 600 nM ceritinib or their combination for 72h, cells were fixed and stained by DAPI and cell number was counted. B, Patient 10004 derived tumor cells were transfected with siRNA pools targeting ALK, EGFR or their combination for 96 hours; 500 cells were plated for each group after treatment for colony formation assays, colony numbers were determined by crystal violet staining after 12 days. C, Patient 10004 derived tumor cells were treated with 1 μM gefitinib, 600 nM ceritinib, or the combination of 500 nM gefitinib and 300 nM ceritinib for 72 hours. Cells were stained by annexin V and PI, and flow cytometry was performed to determine the ratio of annexin V positive and PI negative cells for each group. Data represents the mean ± SD, each containing three replicates (n = 3). A one-way ANOVA was performed for statistical analysis.
Figure 4. ALK protein and phosphorylation levels increase after gefitinib treatment in HNSCC patient-derived tumor cells. Patient-derived tumor cells from patient 10004 were treated with gefitinib at 0.03-1 μM or vehicle for 6 hours (A), 24 hours (B), 48 hours (C) and 72 hours (D). Levels of total and phospho-EGFR and ALK, as well as alpha-tubulin, were assessed by immunoblot analysis. Total and phospho-ALK bands are indicated by arrows. E, Quantification of ALK protein expression after 48 hours of gefitinib treatment. Data represents the mean ± SD, each containing three independent experiments (n = 3). F, Immunofluorescent staining of ALK protein (red) and the nucleus (blue) on 10004 patient tumor cell derived spheroids treated with gefitinib 1 μM or vehicle. Scale bar = 100µm G, Data represents the mean fluorescent intensity of ALK normalized to the volume of the gefitinib treated (n = 9) and vehicle treated (n = 5) spheroids.
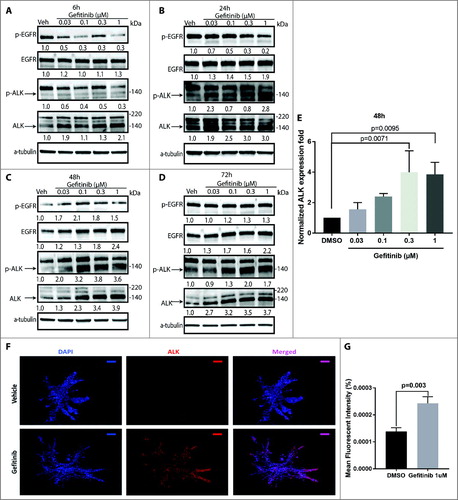
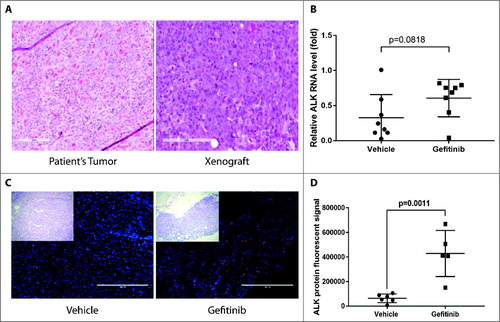
Figure 5. ALK RNA and protein levels increase after gefitinib treatment in HNSCC patient-derived xenografts. Patient-derived tumor cells from patient 10004 were subcutaneously injected into NSG mice. Mice were treated with 100 mg/kg gefitinib or vehicle for 48 hours. A, Morphology of a xenograft tumor and the original patient tumor were shown. B, Quantification of ALK RNA expression after 48 hours of gefitinib treatment. Data represents the mean ± SD (n = 8). C, Immunofluorescent staining of ALK protein (red) and the nucleus (blue) on 10004 patient-derived xenografts treated with gefitinib or vehicle. Scale bar = 400µm D, Data represents the integrated density (positive area x mean fluorescent intensity) of ALK staining in gefitinib treated and vehicle treated mice (n = 5-6).