1,283
Views
0
CrossRef citations to date
0
Altmetric
Research Paper

A fragment of SPARC reflecting increased collagen affinity shows pathological relevance in lung cancer – implications of a new collagen chaperone function of SPARC

, , , , , & show all
Pages 904-912 | Received 04 Apr 2018, Accepted 22 May 2018, Published online: 01 Aug 2018

Figures & data

Figure 1. The structure of SPARC and bioactive peptides.

The SPARC protein is divided into three different modules containing bioactive peptides. Peptide 1.1 inhibits spreading of endothelial cells and fibroblasts and potentiates MMP-2 activation. Peptide 2.1 inhibits proliferation of endothelial cells but stimulates proliferation of fibroblasts. Peptide 2.3 stimulates endothelial cell proliferation and angiogenesis. Peptide 3.2 induces MMP production. Peptide 4.2 inhibits cell spreading of endothelial cells and fibroblasts, but stimulates endothelial cell migration. Peptide Z-1 has biphasic effect on endothelial cell proliferation and stimulates vascular growth. Peptides Z-2 and Z-3 inhibit endothelial cell proliferation, but stimulate their migration. Collagen binding sites are shown with orange circles. The red triangle represents the cleavage site associated with increased collagen affinity.

Figure 1. The structure of SPARC and bioactive peptides.The SPARC protein is divided into three different modules containing bioactive peptides. Peptide 1.1 inhibits spreading of endothelial cells and fibroblasts and potentiates MMP-2 activation. Peptide 2.1 inhibits proliferation of endothelial cells but stimulates proliferation of fibroblasts. Peptide 2.3 stimulates endothelial cell proliferation and angiogenesis. Peptide 3.2 induces MMP production. Peptide 4.2 inhibits cell spreading of endothelial cells and fibroblasts, but stimulates endothelial cell migration. Peptide Z-1 has biphasic effect on endothelial cell proliferation and stimulates vascular growth. Peptides Z-2 and Z-3 inhibit endothelial cell proliferation, but stimulate their migration. Collagen binding sites are shown with orange circles. The red triangle represents the cleavage site associated with increased collagen affinity.

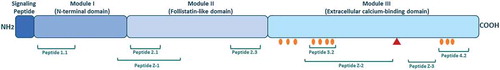
Table 1. Synthetic peptides used for development and validation of the SPARC-M ELISA assay.

Figure 2. Specificity of the SPARC-M monoclonal antibody.

Monoclonal antibody reactivity towards (A) the calibrator peptide (LLARDFEKNY), the elongated peptide (ELLARDFEKNY), the truncated peptide (LARDFEKNY) a non-sense peptide (VPKDLPPDTT) and a non-sense coating peptide (VPKDLPPDTT-biotin) and (B) Von Willebrand factor (VWF), ADAMTS15 (A15), SPARC-like protein 1 (SLP1) and glucagon (GCG), was tested for in the competitive SPARC-M ELISA. Signals are shown as optical density (OD) at 450 nm (subtracted the background at 650 nm) as a function of peptide concentration.

Figure 2. Specificity of the SPARC-M monoclonal antibody.Monoclonal antibody reactivity towards (A) the calibrator peptide (LLARDFEKNY), the elongated peptide (ELLARDFEKNY), the truncated peptide (LARDFEKNY) a non-sense peptide (VPKDLPPDTT) and a non-sense coating peptide (VPKDLPPDTT-biotin) and (B) Von Willebrand factor (VWF), ADAMTS15 (A15), SPARC-like protein 1 (SLP1) and glucagon (GCG), was tested for in the competitive SPARC-M ELISA. Signals are shown as optical density (OD) at 450 nm (subtracted the background at 650 nm) as a function of peptide concentration.

Figure 3. Cleavage of SPARC by MMP-8 and MMP-13.

SPARC was incubated with different MMP’s and SPARC-M levels were measured after 24 hours. Data were normalized by subtracting the background measured in buffer alone. The graph below is representative of two experiments.

Figure 3. Cleavage of SPARC by MMP-8 and MMP-13.SPARC was incubated with different MMP’s and SPARC-M levels were measured after 24 hours. Data were normalized by subtracting the background measured in buffer alone. The graph below is representative of two experiments.

Table 2. Clinical sample overview and patients demographics.

Table 3. Technical validation data of the SPARC-M ELISA assay.

Figure 4. Serum SPARC-M levels in patients with fibrotic disorders and healthy controls.

(A) Cohort 1: Serum SPARC-M was assessed in healthy controls (n = 6), IPF patients (n = 7), COPD patients (n = 8) and lung cancer patients (n = 8). Groups were compared using Kruskal-Wallis adjusted for Dunn’s multiple comparisons test. (B) Cohort 2: Serum SPARC-M was assessed in healthy controls (n = 20) and lung cancer patients (n = 40). Groups were compared using unpaired, two-tailed Mann-Whitney test. (C) Lung cancer patients (from cohort 2) were stratified according to their cancer stage (stage I-IV, n = 10 in each group). Data were compared using Kruskal-Wallis adjusted for Dunn’s multiple comparisons test. All Data are shown as Tukey box plots. Significance level: *: p < 0.05, ***: p < 0.001, ****: p < 0.0001.

Figure 4. Serum SPARC-M levels in patients with fibrotic disorders and healthy controls.(A) Cohort 1: Serum SPARC-M was assessed in healthy controls (n = 6), IPF patients (n = 7), COPD patients (n = 8) and lung cancer patients (n = 8). Groups were compared using Kruskal-Wallis adjusted for Dunn’s multiple comparisons test. (B) Cohort 2: Serum SPARC-M was assessed in healthy controls (n = 20) and lung cancer patients (n = 40). Groups were compared using unpaired, two-tailed Mann-Whitney test. (C) Lung cancer patients (from cohort 2) were stratified according to their cancer stage (stage I-IV, n = 10 in each group). Data were compared using Kruskal-Wallis adjusted for Dunn’s multiple comparisons test. All Data are shown as Tukey box plots. Significance level: *: p < 0.05, ***: p < 0.001, ****: p < 0.0001.

Figure 5. SPARC inhibits fibrillar collagen degradation by MMP-9.

(A) Type I collagen or (B) type III collagen was incubated with MMP-9 alone or together with MMP-9 and SPARC. (C) Type I collagen was incubated with MMP-13 alone or together with MMP-13 and SPARC. The solutions incubated at 37°C for 1 h, 4 h, 8 h and 24 h. The reaction was stopped by adding 1 µM EDTA to the solutions. Collagen degradation was measured with ELISAs targeting MMP-9 and MMP-13 degraded type I collagen, C1M (A)(C) and MMP-9 degraded type III collagen, C3M (B). MMP-buffer with either MMP’s or collagen alone were included as negative controls. Data were normalized by subtracting the background measured in buffer alone. The graphs below are representative of two experiments.

Figure 5. SPARC inhibits fibrillar collagen degradation by MMP-9.(A) Type I collagen or (B) type III collagen was incubated with MMP-9 alone or together with MMP-9 and SPARC. (C) Type I collagen was incubated with MMP-13 alone or together with MMP-13 and SPARC. The solutions incubated at 37°C for 1 h, 4 h, 8 h and 24 h. The reaction was stopped by adding 1 µM EDTA to the solutions. Collagen degradation was measured with ELISAs targeting MMP-9 and MMP-13 degraded type I collagen, C1M (A)(C) and MMP-9 degraded type III collagen, C3M (B). MMP-buffer with either MMP’s or collagen alone were included as negative controls. Data were normalized by subtracting the background measured in buffer alone. The graphs below are representative of two experiments.

Reprints and Corporate Permissions

Please note: Selecting permissions does not provide access to the full text of the article, please see our help page How do I view content?

To request a reprint or corporate permissions for this article, please click on the relevant link below:

Academic Permissions

Please note: Selecting permissions does not provide access to the full text of the article, please see our help page How do I view content?

Obtain permissions instantly via Rightslink by clicking on the button below:

If you are unable to obtain permissions via Rightslink, please complete and submit this Permissions form. For more information, please visit our Permissions help page.