Figures & data
Figure 1. Cellular uptake of AuNPs by MDA-MBA 231 cells
(A) TEM images of MDA MB 231 cells exposed to 4 nm AuNPs showing the internalized high electron density-staining particles inside vesicles (red arrows). (B) TEM images of MDA MB 231 cells incubated with 14 nm AuNPs where some AuNPs were detected inside the cytoplasmic vesicles (red arrows), while portion some AuNPs were found within the nuclei (red arrows; bottom panels). (C) TEM image of MDA MB 231 cells not exposed to AuNPs (control).
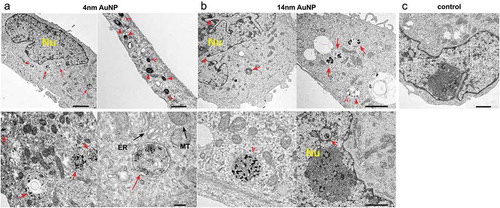
Figure 2. Effect of AuNPs on RT induced tumor growth delay
Primary tumor volumes were measured at 3–4 days intervals by calipers and calculated using the formula: 4∕3π x Length x Width x ((Length + Width)/2)/8. Percentage of tumor volume change over time in mice treated with 4 nm AuNPs (n = 5) (A) and 14 nm AuNPs (n = 5–9) (B). Data represent mean ± SEM *p < .05 compared to control; **p < .05 compared to RT alone.
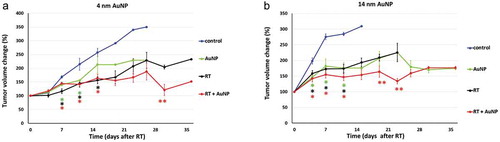
Figure 3. Effect of AuNPs and RT on body weight change
(A) Percentage body weight change in animals receiving 4 nm AuNP. Animals were weighed two times per week; Data represent mean ± SEM (n = 5). *p < .05 for 4 nm AuNP alone compared to control; **p < .05 for RT compared to control; ***p < .05 for RT + 4 nm AuNP compared to control (B) Percentage body weight change in animals receiving 14 nm AuNP. Animals were weighed two times per week; Data represent mean ± SEM (n = 5–9). *p < .05 for 4 nm AuNP alone compared to control; **p < .05 for 4 nm AuNP alone compared to RT alone.
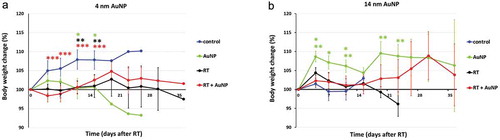
Figure 4. Effect of AuNPs and AuNP enhanced RT on survival
Survival analysis by log rank Mantel Cox test. Compared to untreated control groups, significantly prolonged survival was achieved for the following groups: RT alone and RT + 4 nm AuNP (A), and RT alone, 14 nm AuNP alone and RT + 14 nm AuNP (B). Compared to RT alone treatment groups, significantly prolonged survival was achieved for the following groups: 14 nm AuNP alone and RT + 14 nm AuNP and (B).
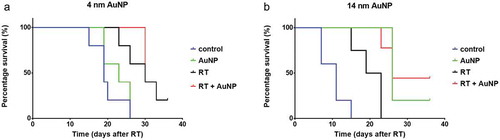
Table 1. Survival analysis - 4nm AuNP experiments
Table 2. Survival analysis - 14nm AuNP experiments
Table 3. Median Survival
Figure 5. Intratumoral distribution of administered AuNP
Macroscopic images of MDA MB 231 transplanted tumors excised at day 26. Tumors extracted from animals receiving 14 nm AuNP (A), 4 nm AuNPs (B) and animals that did not receive any AuNP (C).
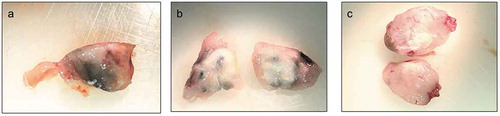
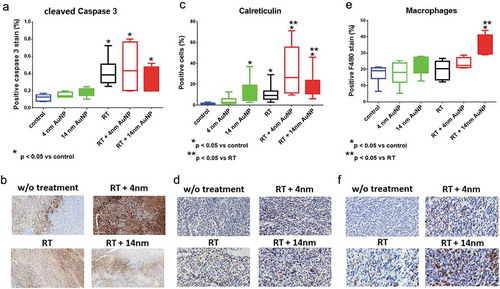
Figure 6. Effect of AuNPs and AuNP enhanced RT on tissue expression of cleaved Caspase 3, Calreticulin and macrophage infiltration
Immunohistochemistry analysis of the percentage of positive stain for cleaved Caspase 3 (A) and F 4/80 (E) and for the percentage of cells positive for Calreticulin (C). Digitalized tissue stains were evaluated for staining extent and intensity by QuPath software custom made application. Data expressed as mean + SEM (n = 5). *p < .05 compared to control; **p < .05 compared to RT alone. Corresponding representative images of tissue stains are shown in panels B, D and F.