Figures & data
Figure 1. Typical LysoTracker Red staining, MDC staining, and Western blotting analysis of autophagy markers in notochordal cells under various osmolalities for different times. (A) After 24 hours of treatment, cells were stained with MDC and LysoTracker Red, and then observed under a fluorescence microscope. (magnification ×200). (B, C, D, F, H) Western blotting analysis of LC3-II and Beclin-1 expression in cells under increasing osmolality for 6 (B) and 12 hours (C), or under 600 mOsm for 0–24 hours (D). The optical densities of LC3-II/β-actin bands in (B and C and D) are shown in (F) and (H) respectively. (E, G, H) Western blotting analysis of SOSTM1/P62 expression in cells under increasing osmolality for 6–24 hours (E). The optical densities of SQSTM1/P62 β-actin bands in (D) and (E) are shown in (H) and (G) respectively. Values are the mean ± SD , *P < 0.05, **P < 0.01, compared with 270 mOsm or 0 hour. n = 6.
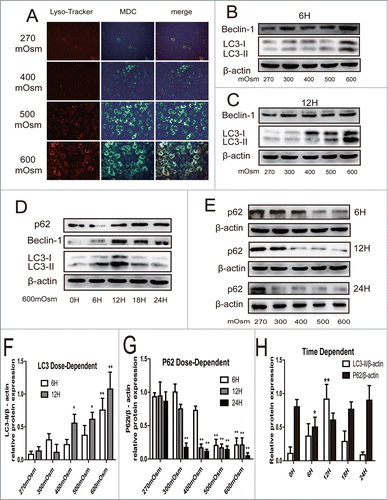
Figure 2. Autophagy analyzed by immunofluorescence and Western blotting analysis for LC3, as well as transmission electron microscopy to detect autophagosomes. Representative images are shown. (A, D) After 12 hours of treatment with 270, 500, or 600 mOsm or 10 μM rapamycin, LC3 expression was analyzed by immunofluorescence under confocal microscopy (magnification ×400). The percentage of LC-3-positive cells is shown in (D). (B, E) Under the same treatment as above, LC3 expression was detected by Western blotting. The optical densities ofthe LC3-II/β-actin bands are shown in (E). (C, F) Cells were treated with 600 mOsm or Bafilomycin A1, or co-treatment with both for 12 hours, and LC3 expression was detected by Western blotting. The optical densities of theLC3-II/β-actin bands are shown in (F). Values are the mean ± SD , *P < 0.05, **P < 0.01. n = 6. (G) Notochordal cells were treated with 270, 500 or 600 mOsm for 24 hours, and transmission electron microscopy was used to detect autophagosomes andautophagolysosomes. White star, mitochondria; white arrow: autophagosome; white triangle, autophagolysosome.
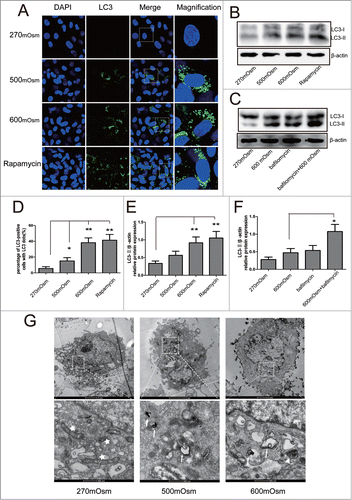
Figure 3. Involvement of [Ca2+]i levels in hyperosmotic stress-induced autophagy. (A, B) Cells preloaded with fluo3-AM were stimulated by 600 mOsm medium and examined under a confocal microscope. Serialfluorescent images were captured every 20 seconds. Some representative images are shown in (A)(magnification ×600). Relative fluorescence values were calculated as ΔF/F0 to represent the relative [Ca2+]i levels. To detect the Ca2+ pathway, cells were pre-incubated with 100 mM BAPTA-AM, 1 mM EGTA or 10 μM U73122, following fluo3-AM fluorescence analysis (B). (C, D) Western blotting analysis for LC3 in cells treated with 270 mOsm, 600 mOsm, 270+ BAPTA-AM, or 600 mOsm+ BAPTA-AM. Values are mean ± SD , **P < 0.01. n = 6.
![Figure 3. Involvement of [Ca2+]i levels in hyperosmotic stress-induced autophagy. (A, B) Cells preloaded with fluo3-AM were stimulated by 600 mOsm medium and examined under a confocal microscope. Serialfluorescent images were captured every 20 seconds. Some representative images are shown in (A)(magnification ×600). Relative fluorescence values were calculated as ΔF/F0 to represent the relative [Ca2+]i levels. To detect the Ca2+ pathway, cells were pre-incubated with 100 mM BAPTA-AM, 1 mM EGTA or 10 μM U73122, following fluo3-AM fluorescence analysis (B). (C, D) Western blotting analysis for LC3 in cells treated with 270 mOsm, 600 mOsm, 270+ BAPTA-AM, or 600 mOsm+ BAPTA-AM. Values are mean ± SD , **P < 0.01. n = 6.](/cms/asset/c9a60690-9b97-4728-b221-6ca0b79e6daa/kccy_a_1004946_f0003_oc.gif)
Figure 4. Activation of the AMPK/mTOR pathway detected by Western blotting analysis under hyperosmotic conditions. Typical bands are shown. (A, B) Cells were treated with 270 or 600 mOsm for 12 hours and analyzed by Western blotting analysis. The optical densities ofP-p70S6K/ p70S6K and P-AMPK/AMPK bands in (A) are shown in (B). Values are mean ± SD . *P < 0.05 versus 270 mOsm respectively. n = 6. (C, D) Notochordal cells were treated with 270 mOsmor with 270+600 mOsm. The optical densities ofthe LC3-II/β-actin bands are shown in (D). Values aremean ± SD , *P < 0.05. n = 6.
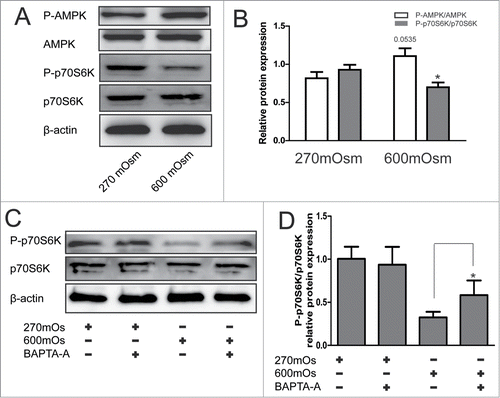
Figure 5. Inhibition of autophagy by ATG5 siRNA. Typical images and bands are shown. (A) Western blotting analysis for ATG5 in cells after transfection with ATG5 or control siRNA. (B, C) Western blotting analysis for LC3 in cells treated with normal medium or hyperosmotic medium combined with ATG5 siRNA or control siRNA. (D, E) Western blotting and immunofluorescence analysis for SQSTM1/P62 in cells treated with normal medium or hyperosmotic medium combined with ATG5 siRNA or control siRNA. (magnification × 400).
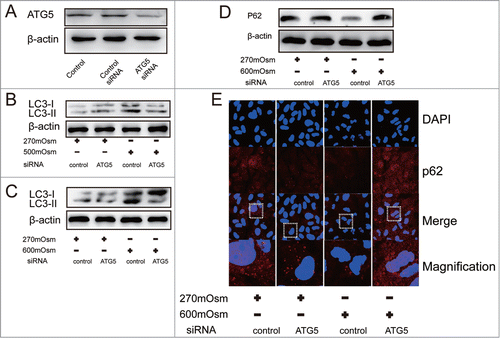
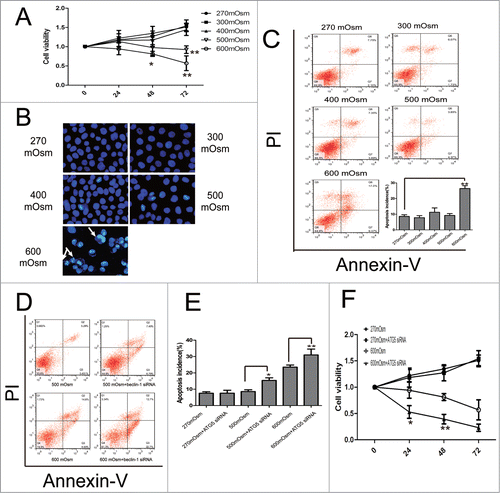
Figure 6. Apoptosis under hyperosmotic stress and inhibition of autophagy exacerbates apoptosis in notochordal cells. Typical images are shown. (A) Cell viability was analyzed by CCK-8 assay. *P < 0.05, **P < 0.01, vs. 270 mOsm for the same durations. (B, C) Following treatment with the indicated media for 24 hours, notochordal cells were stained with DAPI (B) or co-stained with Annexin-V and PI (C), followed by observation by fluorescence microscopy or flow cytometry to analyze the percentage of apoptotic cells. (D) Notochordal cells were treated with 500 or 600 mOsm, or co-treated with 500 or 600 mOsm plus ATG5 siRNA transfection for 24 hours. Apoptotic incidence (E) was calculated according to the flow cytometry results (D). Cell viability was analyzed by CCK-8 assay. (G) *P < 0.05, **P < 0.01 versus 270 mOsm for the same durations.
