1,754
Views
44
CrossRef citations to date
0
Altmetric
Report

Extracellular acidity strengthens mesenchymal stem cells to promote melanoma progression

, , , , &
Pages 3088-3100 | Received 08 Apr 2015, Accepted 26 Jul 2015, Published online: 23 Oct 2015

Figures & data

Figure 1. Low pH-exposed MSC enhance in vivo and in vitro melanoma growth. (A) Tumor growth of SCID bg/bg mice inoculated with melanoma cells alone or together with MSC grown in standard or acidic medium. (B) Cell growth of A375M6 human melanoma cells treated with medium conditioned by MSC previously grown in standard pH medium (SpH-MSC A375M6) or by MSC grown in low pH medium (LpH-MSC A375M6). (C) Western blot analysis of PARP expression in A375M6 cells grown in media conditioned by acidic or non acidic MSC and treated with H2O2. Bar graph derived from the ratio between Cleaved Parp and Parp normalized to the intensity of β-Tubulin bands. Values presented are means ±SEM of 3 independent experiments. Asterisk indicates p < 0.05.
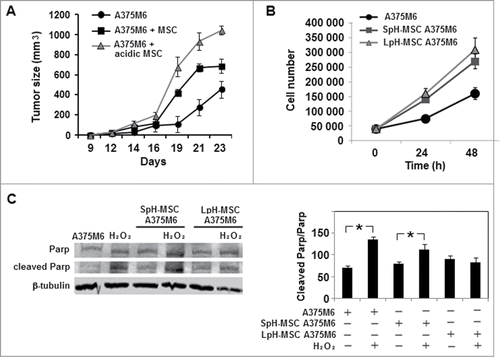
Figure 1. Low pH-exposed MSC enhance in vivo and in vitro melanoma growth. (A) Tumor growth of SCID bg/bg mice inoculated with melanoma cells alone or together with MSC grown in standard or acidic medium. (B) Cell growth of A375M6 human melanoma cells treated with medium conditioned by MSC previously grown in standard pH medium (SpH-MSC A375M6) or by MSC grown in low pH medium (LpH-MSC A375M6). (C) Western blot analysis of PARP expression in A375M6 cells grown in media conditioned by acidic or non acidic MSC and treated with H2O2. Bar graph derived from the ratio between Cleaved Parp and Parp normalized to the intensity of β-Tubulin bands. Values presented are means ±SEM of 3 independent experiments. Asterisk indicates p < 0.05.

Figure 2. For figure legend, see next page.

Figure 2. For figure legend, see next page.

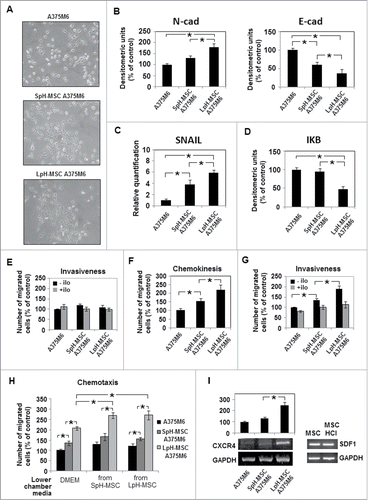
Figure 3. Expression levels of TGFβ and TGFβ receptors in melanoma cells grown in medium conditioned by acidic MSC. qPCR analysis of (A) TGFβ, TGFR1, TGFR2, TGFR3 in melanoma cells treated with conditioned media of MSC grown at low pH. and (B) TGFβ and EMT markers in melanoma cells treated for 24 hours with TGFβ 10 ng/ml. (C) Invasiveness of A375M6 cells treated with TGFβ 10 ng/ml, in the presence or absence of Ilomastat and performed using Matrigel-coated filters. Migration is measured as a percentage of the control. Values presented are means ± SEM of 3 independent experiments. Asterisk indicates p < 0.05
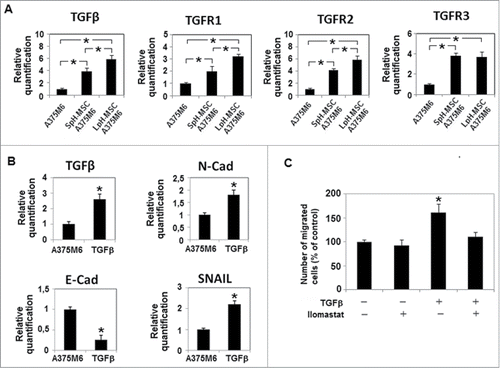
Figure 3. Expression levels of TGFβ and TGFβ receptors in melanoma cells grown in medium conditioned by acidic MSC. qPCR analysis of (A) TGFβ, TGFR1, TGFR2, TGFR3 in melanoma cells treated with conditioned media of MSC grown at low pH. and (B) TGFβ and EMT markers in melanoma cells treated for 24 hours with TGFβ 10 ng/ml. (C) Invasiveness of A375M6 cells treated with TGFβ 10 ng/ml, in the presence or absence of Ilomastat and performed using Matrigel-coated filters. Migration is measured as a percentage of the control. Values presented are means ± SEM of 3 independent experiments. Asterisk indicates p < 0.05

Figure 4. Metabolic profile of acidic MSC. (A) Quantitative real-time PCR of GLUT1, GLUT3, PKM2, LDHA and c-Myc and (B) Western blot analysis of AKT, p-AKT, MCT1 and MCT4 expression in MSC grown in acidic medium for 24 hours. Each band of western blot was quantified by densitometric analysis and the corresponding histogram was constructed as relative to β-tubulin. Values presented are means ±SEM of 3 independent experiments. Asterisk indicates p < 0.05.
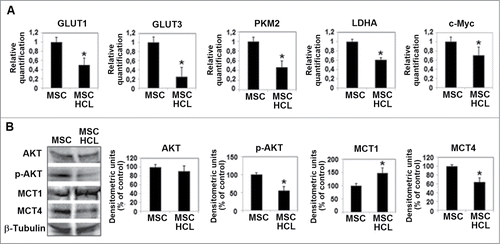
Figure 4. Metabolic profile of acidic MSC. (A) Quantitative real-time PCR of GLUT1, GLUT3, PKM2, LDHA and c-Myc and (B) Western blot analysis of AKT, p-AKT, MCT1 and MCT4 expression in MSC grown in acidic medium for 24 hours. Each band of western blot was quantified by densitometric analysis and the corresponding histogram was constructed as relative to β-tubulin. Values presented are means ±SEM of 3 independent experiments. Asterisk indicates p < 0.05.
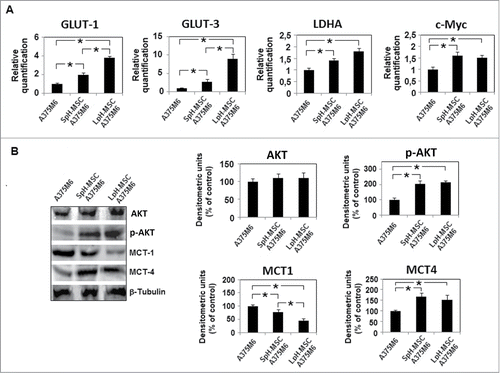
Figure 5. Media conditioned by acidic MSC change the metabolic profile of A375M6 melanoma cells. (A) Quantitative real-time PCR of GLUT1, GLUT3, LDHA and c-Myc and (B) Western blot analysis of AKT, p-AKT, MCT1 and MCT4 expression in melanoma cells grown for 24 hours in media conditioned by non acidic MSC (SpH-MSC A375M6) or acidic MSC (LpH-MSC A375M6). Each band of western blot was quantified by densitometric analysis and the corresponding histogram was constructed as relative to β-tubulin. Values presented are means ±SEM of 3 independent experiments. Asterisk indicates p < 0.05.

Figure 5. Media conditioned by acidic MSC change the metabolic profile of A375M6 melanoma cells. (A) Quantitative real-time PCR of GLUT1, GLUT3, LDHA and c-Myc and (B) Western blot analysis of AKT, p-AKT, MCT1 and MCT4 expression in melanoma cells grown for 24 hours in media conditioned by non acidic MSC (SpH-MSC A375M6) or acidic MSC (LpH-MSC A375M6). Each band of western blot was quantified by densitometric analysis and the corresponding histogram was constructed as relative to β-tubulin. Values presented are means ±SEM of 3 independent experiments. Asterisk indicates p < 0.05.

Figure 6. Metformin acts on MSC metabolism and abolishes the effects of acidic MSC conditioned medium on melanoma cells. MSC were cultured in acidic medium in the presence of metformin 1mM for 24 hours. (A) Evaluation by quantitative real-time PCR of metformin effects on GLUT1, GLUT3 and (B) TGFβ mRNA expression in acidic and non acidic MSC. After 24 hours, melanoma cells were grown in media conditioned by acidic MSC treated with metformin (LpH-metf-MSC A375M6). (C) Quantitative mRNA analysis of EMT-related genes N-Cadherin, Snail, E-Cadherin and (D) GLUT-1 and GLUT-3 in melanoma cells grown in conditioned media conditioned. (E) Cell invasiveness across Matrigel-coated porous menmbranes of Boyden chambers determined in A375M6 cells grown in conditioned media. Migration is measured as a percentage of the control. Data are expressed as means ±SEM of 3 independent experiments. Asterisk indicates p < 0.05.
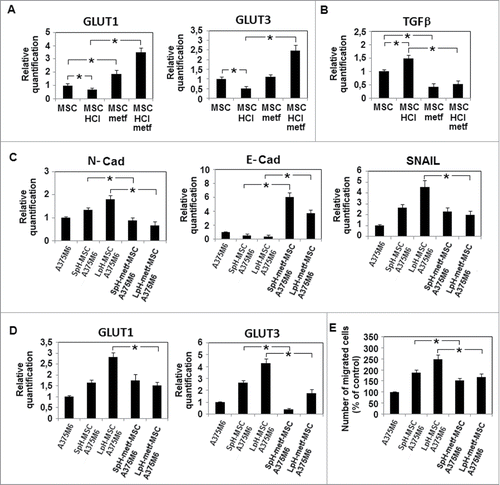
Figure 6. Metformin acts on MSC metabolism and abolishes the effects of acidic MSC conditioned medium on melanoma cells. MSC were cultured in acidic medium in the presence of metformin 1mM for 24 hours. (A) Evaluation by quantitative real-time PCR of metformin effects on GLUT1, GLUT3 and (B) TGFβ mRNA expression in acidic and non acidic MSC. After 24 hours, melanoma cells were grown in media conditioned by acidic MSC treated with metformin (LpH-metf-MSC A375M6). (C) Quantitative mRNA analysis of EMT-related genes N-Cadherin, Snail, E-Cadherin and (D) GLUT-1 and GLUT-3 in melanoma cells grown in conditioned media conditioned. (E) Cell invasiveness across Matrigel-coated porous menmbranes of Boyden chambers determined in A375M6 cells grown in conditioned media. Migration is measured as a percentage of the control. Data are expressed as means ±SEM of 3 independent experiments. Asterisk indicates p < 0.05.

Figure 7. TGFβ−released by acidic MSC drives EMT-like profile of melanoma cells exposed to LpH-MSC medium. MSC were transfected with specific TGFβ siRNAs and treated with acidic medium for 24 hours. (A) Western blot analysis of TGFβ expression in acidic MSC (top panel) and quantitative real-time PCR of TGFβ mRNA expression in MSC after gene silencing (bottom panel). After 24 hours, melanoma cells were grown in media conditioned by acidic MSC silenced for TGFβ. (LpH-si-MSC A375M6) and quantitative real time PCR was used to evaluate the expression of TGFβ (B), genes related to EMT (C) and metabolism (D).18s rRNA was used as reference gene. (E) Invasiveness of A375M6 cells grown in conditioned media, performed using Matrigel-coated filters. Migration is measured as a percentage of the control. (F) Wound healing assay of melanoma cells treated with media conditioned by silenced MSC grown at low pH. The wound closure was evaluated 18 hours since its creation. (G) Quantitative real time PCR was used to evaluate the expression of TGFβ, genes related to EMT and GLUT1 and GLUT3, in melanoma cells grown in media conditioned by acidic MSC and treated with p17, a peptide inhibitor of TGF-β1. Data are expressed as means ±SEM of 3 independent experiments. Asterisk indicates p < 0.05.
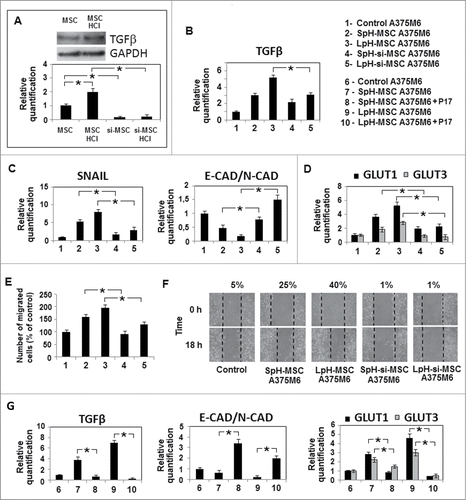
Figure 7. TGFβ−released by acidic MSC drives EMT-like profile of melanoma cells exposed to LpH-MSC medium. MSC were transfected with specific TGFβ siRNAs and treated with acidic medium for 24 hours. (A) Western blot analysis of TGFβ expression in acidic MSC (top panel) and quantitative real-time PCR of TGFβ mRNA expression in MSC after gene silencing (bottom panel). After 24 hours, melanoma cells were grown in media conditioned by acidic MSC silenced for TGFβ. (LpH-si-MSC A375M6) and quantitative real time PCR was used to evaluate the expression of TGFβ (B), genes related to EMT (C) and metabolism (D).18s rRNA was used as reference gene. (E) Invasiveness of A375M6 cells grown in conditioned media, performed using Matrigel-coated filters. Migration is measured as a percentage of the control. (F) Wound healing assay of melanoma cells treated with media conditioned by silenced MSC grown at low pH. The wound closure was evaluated 18 hours since its creation. (G) Quantitative real time PCR was used to evaluate the expression of TGFβ, genes related to EMT and GLUT1 and GLUT3, in melanoma cells grown in media conditioned by acidic MSC and treated with p17, a peptide inhibitor of TGF-β1. Data are expressed as means ±SEM of 3 independent experiments. Asterisk indicates p < 0.05.

Figure 8. Esomeprazole inhibits the aggressiveness of melanoma cells conditioned by acidic MSC. MSC were cultured in acidic medium in the presence of esomeprazole 100μM for 24 hours. (A) Quantitative real-time PCR of TGFβ mRNA expression in MSC. After 24 hours, melanoma cells were grown in media conditioned by acidic MSC treated with esomeprazole (LpH-eso-MSC A375M6) and quantitative real time PCR was used to evaluate the expression of TGFβ (B), genes related to EMT (C) and metabolism (D).18s rRNA was used as reference gene. (E) Inhibition by esomeprazole of invasiveness, performed resuspending melanoma cells in MSC conditioned media, and motility of A375M6 grown in LpH-eso-MSC medium. Migration is measured as a percentage of the control. Data are expressed as means ± SEM of 3 independent experiments. Asterisk indicates p < 0.05.
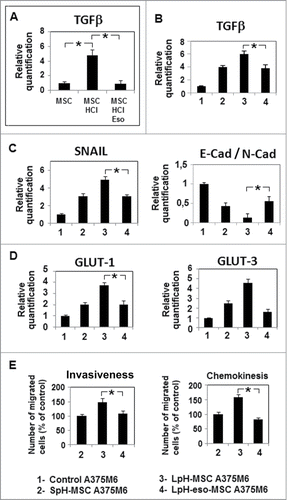
Figure 8. Esomeprazole inhibits the aggressiveness of melanoma cells conditioned by acidic MSC. MSC were cultured in acidic medium in the presence of esomeprazole 100μM for 24 hours. (A) Quantitative real-time PCR of TGFβ mRNA expression in MSC. After 24 hours, melanoma cells were grown in media conditioned by acidic MSC treated with esomeprazole (LpH-eso-MSC A375M6) and quantitative real time PCR was used to evaluate the expression of TGFβ (B), genes related to EMT (C) and metabolism (D).18s rRNA was used as reference gene. (E) Inhibition by esomeprazole of invasiveness, performed resuspending melanoma cells in MSC conditioned media, and motility of A375M6 grown in LpH-eso-MSC medium. Migration is measured as a percentage of the control. Data are expressed as means ± SEM of 3 independent experiments. Asterisk indicates p < 0.05.

Table 1. Primer sequences for PCR

Reprints and Corporate Permissions

Please note: Selecting permissions does not provide access to the full text of the article, please see our help page How do I view content?

To request a reprint or corporate permissions for this article, please click on the relevant link below:

Academic Permissions

Please note: Selecting permissions does not provide access to the full text of the article, please see our help page How do I view content?

Obtain permissions instantly via Rightslink by clicking on the button below:

If you are unable to obtain permissions via Rightslink, please complete and submit this Permissions form. For more information, please visit our Permissions help page.