Figures & data
Figure 1. Depletion of STARD9 with shRNA and siRNA. Western blot of control, shControl, shSTARD9 (a), siControl, and siRNAs (b) treated cell extract of HeLa cells. The experiment was performed thrice for shRNA and twice for siRNA.
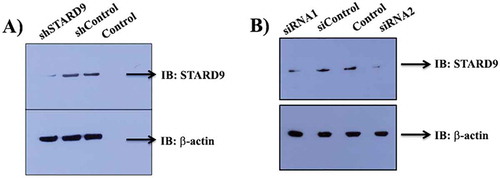
Figure 2. STARD9 depletion with shRNA depolymerizes microtubules in HeLa cells. (a) HeLa cells were seeded on coverslips and transfection was performed without or with shControl or shSTARD9 with lipofectamine 3000 for 48 h. Further, immunostaining was performed with anti-tubulin IgG (left panel). In a separate experiment, the control and STARD9-depleted HeLa cells were incubated with 100 nM nocodazole for 2 h and immunostaining was done as mentioned above (right panel). Scale bar represents 10 μm. (b) The fluorescence intensity represents an average value obtained (n = 50 cells) from the region of interest (ROI). Error bar represents S.D. and p-value (** < 0.001; * < 0.05) was determined by student t-test. (c) HeLa cells were treated without or with shControl or shSTARD9 for 48 h and the cells were collected by centrifugation. The soluble fraction of tubulin was obtained by incubating the cell pellet with PEM buffer containing 0.5% triton X-100 and 25% glycerol for 2 min at 37°C. The polymeric tubulin was obtained by re-suspending the pellet in RIPA buffer for 1 h at 4°C. An equal amount of proteins was analyzed on SDS-PAGE and immuno-blotting was performed with anti-tubulin IgG. The experiment was performed 5 times. (d) The intensity of soluble and polymer tubulin was quantified with ImageJ and is plotted as an average of the ratio of polymer/soluble obtained from 5 independent set of experiments. Error bar represents S.D. and ** indicates p < 0.001.
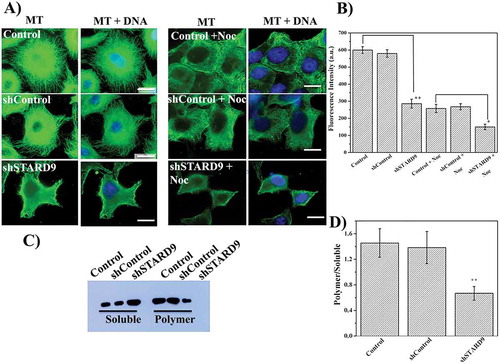
Figure 3. Depletion of STARD9 with siRNA depolymerizes microtubules in HeLa cells. (a) STARD9 depletion was performed with two different siRNAs (siRNA1 and siRNA2) and a scrambled siRNA with lipofectamine RNAiMAX for 48 h. Immunostaining was performed with anti-tubulin IgG. DNA staining was done with Hoechst 33258. Scale bar represents 10 µm. (b) The graph is plotted as an average microtubule intensity of 50 cells in case of control, siRNA1, siRNA2 or scrambled treated cells. The intensity of microtubule was determined using imageJ. ** indicates p < 0.001.
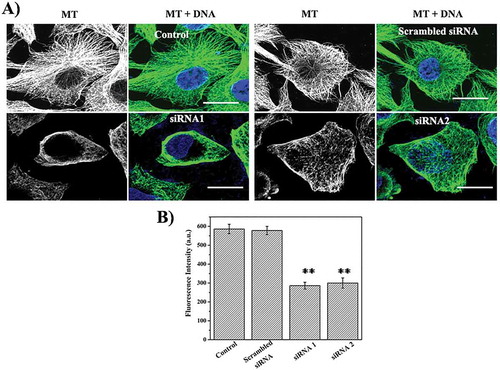
Figure 4. Expression of STARD9-MD stabilizes microtubules against nocodazole and cold. (a) HeLa cells were non-transfected or transfected with GFP-STARD9-MD or STARD9-MD R223A (mutant) for 24 h. The cells were fixed and immunostaining was performed with anti-α tubulin IgG. The control and transfected HeLa cells (indicated by arrows, GFP-STARD9-MD or STARD9-MD R223A) were incubated with (b) 300 nM nocodazole for 1 h or (c) cold (ice) for 30 min and processed for immunostaining with anti-tubulin IgG. DNA was stained with Hoechst 33258. Scale bar: 10 µm. (d) The average fluorescence intensity of microtubules from 50 cells was determined in case of control transfected HeLa cells with and without treatment with cold or nocodazole. Error bar indicates S.D. and p < 0.001(**).
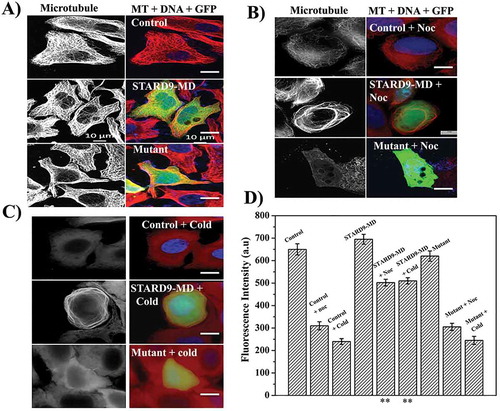
Table 1. The rate constant and the half recovery time were determined from the analysis of fluorescent values fitted in the equation mentioned in method section using GraphPad Prism software. Shown are the average rate constant (k) and t1/2 values with ± as S.D. and n represents the number of cells scored in each case.
Figure 5. STARD9 depletion suppressed spindle microtubule dynamics in HeLa cells. (a) HeLa cells expressing GFP-α-tubulin were either treated without or with shControl or shSTARD9 for 36 h. Further, cells were blocked at interphase using 2 mM thymidine for 18 h. Five-hour post-release of thymidine fluorescent recovery after photobleaching (FRAP) was performed with the mitotic (bipolar) HeLa cells by bleaching a rectangular area with a high-intensity laser. Shown are the representative images obtained pre-bleach and post-bleach in case of control, shControl and shSTARD9 treated HeLa cells. Live cell imaging was done with confocal laser scanning microscope equipped with temperature (37°C) and CO2 (5%) control unit. Scale bar is shown in the figure. (b) The % fluorescence recovery of 15 cells in each experimental condition was plotted against time with ± as a standard deviation. (c) Control, shSTARD9, and shControl HeLa cells were fixed and immunostained with anti-γ-tubulin IgG and anti-α tubulin IgG. DNA was stained with Hoechst 33258. Scale bar shown in the figure. Shown is the maximum intensity projection of z-stacks in each case. (d) The graph is plotted as an average of the interpolar distance calculated from 30 cells in case of control, shControl and shSTARD9 depleted HeLa cells. Error bar indicates S.D. ** indicates p < 0.001.
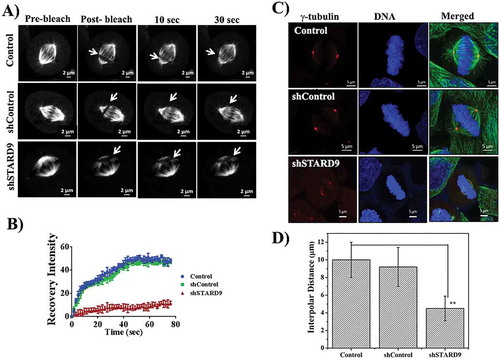
Figure 6. STARD9 depletion inhibited microtubule reassembly in interphase HeLa cells. (a) Microtubules were disassembled by incubating the cells on ice. The reassembly kinetics of the microtubules was monitored by incubating the cells for different (0, 5, 10, 15, 20, 25 and 30 min) durations at 37°C. The cells were fixed at the indicated time point and immunostaining was performed with anti-α tubulin IgG. Scale bar represents 10 µm. The experiment was performed twice. (b) The bar graph represents the fluorescence intensities of microtubules in control and STARD9-depleted HeLa cells fixed at different time points. In each time point, 50 cells were measured. The experiment was performed twice. ± indicates S.D., p < 0.001.
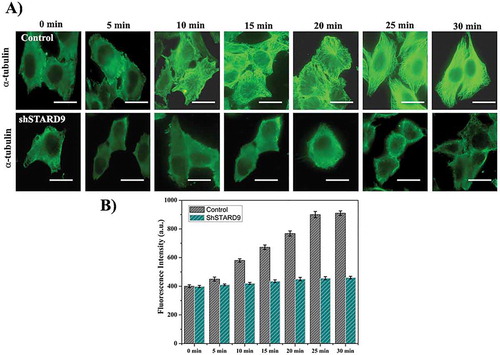
Figure 7. STARD9 depletion inhibited the reassembly of mitotic spindles. Shown are the representative mitotic cells in control and STARD9-depleted HeLa cells at different (0, 5, 10, 15, 20, 25 and 30 min) time intervals. Scale bar represents 10 µm. DNA was stained with hoechst 33258. The experiment was conducted two times.
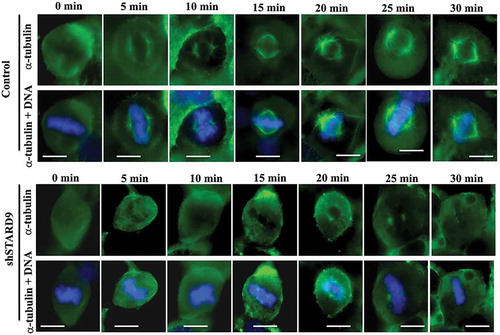
Figure 8. Vinblastine treatment produced a strong anti-proliferative effect in STARD9-depleted HeLa cells. (a) STARD9 depletion was done in HeLa cells for 36 h with shSTARD9. The control (●) and shSTARD9 depleted (■) HeLa cells were incubated with different concentrations (78, 156, 310, 625, 1250, 2500, 5000, 10000, 20000, 40000 pM) of vinblastine for 24 h. The inhibition of cell proliferation was determined by sulforhodamine B assay. The average value determined from three independent sets of experiments is provided. Error bars indicate S.D., p < 0.05. (b) Control and STARD9-depleted HeLa cells were incubated without and with vinblastine (2 and 4 nM) for 10 h and processed for immunostaining with anti-α-tubulin IgG. DNA was stained with Hoechst 33258 and scale bar represents 10 μm.
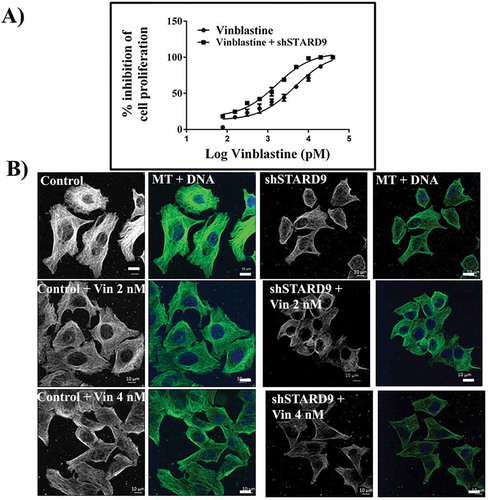
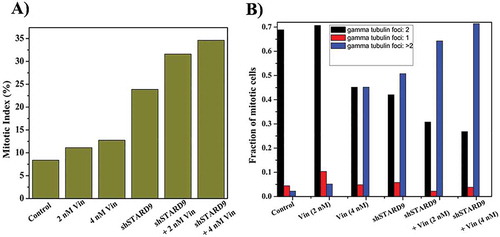
Figure 9. Vinblastine treatment increased mitotic index and multipolar cells in STARD9-depleted HeLa cells. (a) HeLa cells were treated without or with shControl or shSTARD9 for 36 h. Subsequently, the cells were incubated without or with vinblastine (2 and 4 nM) for 10 h. Immunostaining was performed with anti-γ-tubulin IgG. The chromosomes were stained with Hoechst 33258. Further, the mitotic index (ratio of the number of cells at mitosis/total number of cells × 100) was determined in each case. The number of cells scored was 500 for each of the experimental conditions. (b) Number of cells with single, double or multiple gamma-tubulin foci were scored and plotted as a fraction of total mitotic cells. A total number of mitotic cells taken for calculation were 250 in each case. The experiment was performed twice.