Figures & data
Figure 1. Curcumin abolishes the nucleolar localization of TP53INP2. (a) Schematic of the workflow of GFP-TP53INP2-based screening method for novel rDNA transcription potential inhibitors. (b) Subcellular localization of GFP-TP53INP2 in mouse embryonic fibroblasts (MEFs) stably expressing GFP-TP53INP2. The cells were treated with the solvent DMSO, curcumin (Cur) or starvation medium (ST) for 1 h. DMSO-treated cells were used as a negative control, and starvation medium-treated cells were used as a positive control. Scale bars, 10 µm. (c) Quantification of the cells with nuclear distribution of GFP-TP53INP2 per 30 cells in (b). The statistical data are presented as mean ± SEM of three independent experiments. **P < 0.01, ***P < 0.001. (d) Western blots of subcellular fractions from MEFs stably expressing GFP-TP53INP2 treated with curcumin for the indicated time
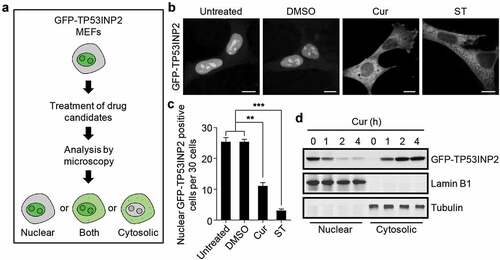
Figure 2. Curcumin represses rDNA transcription. (a) Cellular 47S rRNA level was measured by real-time PCR and normalized to β-actin mRNA. The cells were treated with DMSO, curcumin or rapamycin (Rapa), an mTOR inhibitor, respectively. The rapamycin-treated cells were used as a positive control. (b) HEK293 cells transfected with the indicated plasmids were treated with curcumin or rapamycin. After 3 h, luciferase activity was measured. (c) HEK293 cells were treated with curcumin or rapamycin and subjected to ChIP assay using an anti-UBF or anti-POLR1A antibody. The relative enrichment was determined by real-time PCR using primer set H42.9. (d) HEK293 cells were treated with curcumin for the indicated time and subjected to immunoprecipitation by anti-UBF, followed by western blot to detect POLR1A. The statistical data are presented as mean ± SEM of three independent experiments. *P < 0.05, **P < 0.01, ***P < 0.001
Figure 3. Curcumin stimulates autophagy initiation. (a) Formation of GFP-LC3 puncta in HEK293 cells stably expressing GFP-LC3. The cells were treated with curcumin, rapamycin or chloroquine (CQ), a lysosome inhibitor, respectively. Scale bars, 10 µm. (b) Statistical analysis of the number of GFP-LC3 puncta per cell in (a). Data are shown as mean ± SEM; n = 30. ***P < 0.001. (c) The protein level of p62 in WT MEFs or Atg7−/- MEFs treated with curcumin, rapamycin or chloroquine, respectively. (d) Quantification of p62 protein level in (c). The statistical data are presented as mean ± SEM of three independent experiments. ***P < 0.001. (e) Formation of GFP-DFCP1 puncta in HEK293 cells stably expressing GFP-DFCP1. The cells were treated with curcumin or rapamycin. Scale bars, 10 µm. (f) Statistical analysis of the number of GFP-DFCP1 puncta per cell in (e). Data are shown as mean ± SEM; n = 30. **P < 0.001
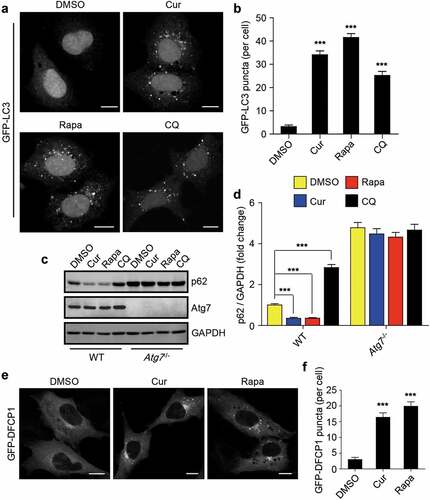
Figure 4. Curcumin inhibits mTORC1 activity. (a and b) Phosphorylation of S6K1 at Thr389 in cells treated with curcumin or rapamycin. (c) Subcellular localization of mTOR and LAMP2 in HEK293 cells. The cells were treated with or without curcumin. After 4 h, the cells were amino acid-starved for 50 min, and re-stimulated with amino acids after the starvation for 10 min, and were subjected to immunostaining using anti-mTOR and anti-LAMP2. Scale bars, 10 µm. (d) Subcellular localization of TFEB-GFP in HEK293 cells stably expressing TFEB-GFP. The cells were treated with curcumin or rapamycin. Scale bars, 10 µm
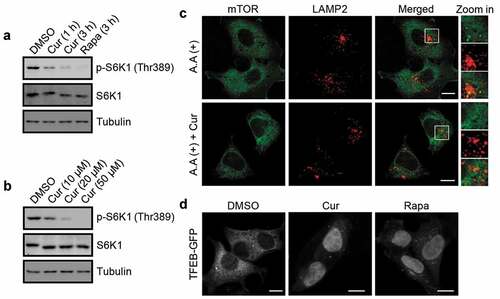
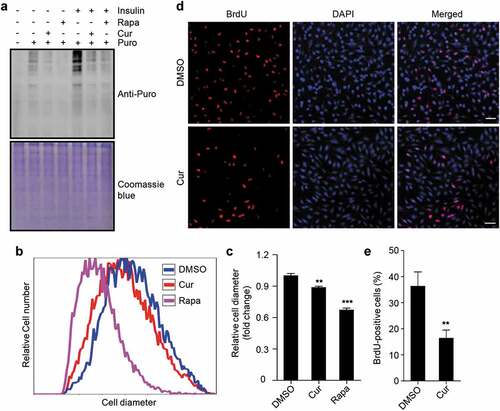
Figure 5. Curcumin suppresses protein synthesis, cell growth, and cell proliferation. (a) Global protein synthesis detected by SUnSET in HEK293 cells. The cells were cultured with or without insulin, and treated with curcumin or rapamycin. The specificity of the anti-puromycin (Puro) antibody was demonstrated by a sample without puromycin treatment. Coomassie blue staining was used as loading control. (b) Relative cell diameter of cells treated with curcumin or rapamycin. (c) Statistical analysis of average cell diameter of cells in (b). Data are shown as mean ± SEM; n = 500. **P < 0.01, ***P < 0.001. (d) HEK293 cells treated with or without curcumin. After 24 h, cells were subjected to BrdU incorporation assay. Scale bar: 50 µm. (e) Statistical analysis of the percentage of cells with BrdU incorporation in (d). Data are shown as mean ± SEM; n = 50. **P < 0.01