Figures & data
Figure 1. Atorvastatin suppressed TNF-α-induced matrix degradation in rat NP cells. (a) The CCK-8 assay was used to detect the toxicity of atorvastatin at various concentrations and for different time points in rat NP cells. (b) Real-time PCR was used to test the effect of 20 μM atorvastatin on catabolic gene mRNA expression induced by 50 ng/mL TNF-α. (c) Western blotting analysis showed that 20 μM atorvastatin alleviated the increase in the protein expression of catabolic genes induced by TNF-α. (d, e) Immunofluorescence assays were used to observe the synthesis of collagen type II and aggrecan after 20 μM atorvastatin treatment in the presence of TNF-α (magnification: ×200, scale bar = 50 μm). The data are expressed as the mean ± standard deviation and were analyzed from three independent experiments. *p < 0.05
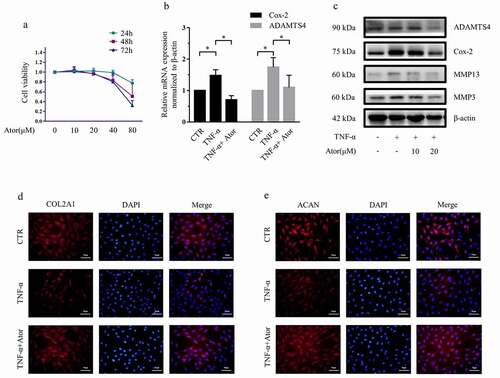
Figure 2. Atorvastatin suppressed TNF-α-induced NLRP3 inflammasome activity in rat NP cells. (a) Real-time PCR was used to confirm that atorvastatin attenuated the TNF-α-induced mRNA expression of NLRP3 inflammasome-related genes. (b, c) Western blotting (b) and subsequent densitometric analyses (c) suggested that atorvastatin significantly suppressed TNF-α-induced NLRP3 inflammasome activity. (d) Immunofluorescence assays were used to observe whether TNF-α enhanced the fluorescence intensity of GSDMD, and the effect was weakened by atorvastatin (magnification: ×200, scale bar = 50 μm). The data are presented as the mean ± standard deviation and were analyzed from three independent experiments. *p < 0.05
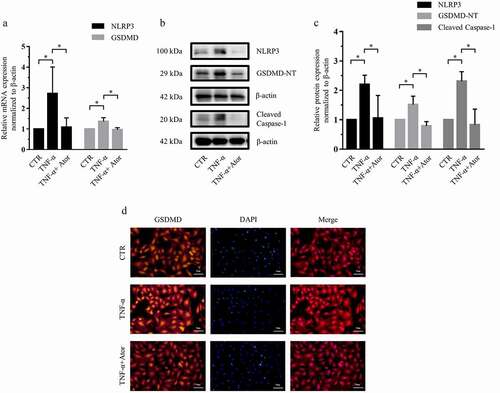
Figure 3. Atorvastatin promoted autophagy in the presence of TNF-α in rat NP cells. (a, b) Western blotting (a) and subsequent densitometric analyses (b) demonstrated that atorvastatin promoted autophagy in the presence of TNF-α. (c) Transfection of rat NP cells with the mRFP-GFP-LC3 adenovirus plasmid clarified the effect of atorvastatin on the formation of autophagosomes under TNF-α stimulation (yellow arrows indicate autophagosomes and red arrows indicated autolysosomes; magnification: ×500, scale bar = 20 μm). (d) Mean number of LC3 puncta of each cell was analyzed and plotted. (e) TEM showed that the production of autophagic vacuoles was obviously visualized in the atorvastatin treatment groups (magnification: ×5000, scale bar = 2 μm). (f) Mean number of autophagic vacuoles of each cell was analyzed and plotted. The data are presented as the mean ± standard deviation and were analyzed from at least three independent experiments. *p < 0.05
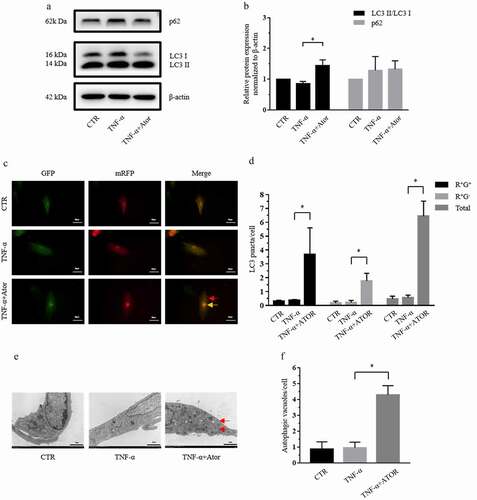
Figure 4. NLRP3 inhibition induced autophagy in rat NP cells. (a, b) Western blotting (a) and subsequent densitometric analyses (b) revealed the effect of various concentrations of the NLRP3 inhibitor MCC950 on autophagy in rat NP cells. (c, d) Western blotting (c) and subsequent densitometric analyses (d) demonstrated that MCC950 treatment enhanced autophagy in the presence of TNF-α. (e) Transfection with the mRFP-GFP-LC3 adenovirus plasmid further confirmed that MCC950 elevated the production of autophagosomes in the presence of TNF-α (yellow arrows indicate autophagosomes and red arrows indicated autolysosomes; magnification: ×500, scale bar = 20 μm). (f) Mean number of LC3 puncta of each cell was analyzed and plotted. The data are presented as the mean ± standard deviation and were analyzed from three independent experiments. *p < 0.05
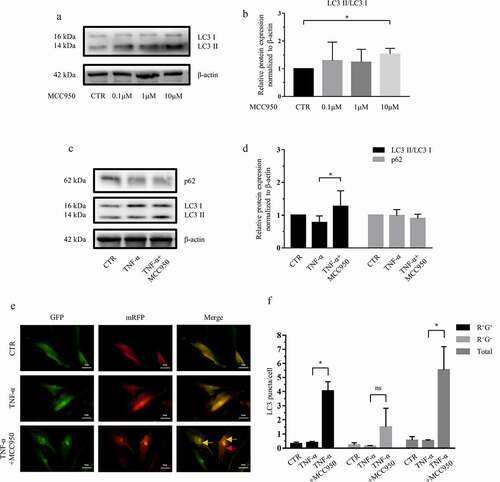
Figure 5. NLRP3 knockdown promoted autophagy in rat NP cells. (a) Rat NP cells were transfected with lentiviral vectors containing shRNA-NLRP3 and shRNA-negative control, and the transfection efficiency was evaluated via fluorescence intensity; magnification: ×100, scale bar = 100 μm. (b, c) Western blotting (b) and subsequent densitometric analyses (c) verified which shRNA-NLRP3 sequence was effective in the presence of TNF-α. (d, e) Western blotting (d) and subsequent densitometric analyses (e) showed that NLRP3 knockdown dramatically suppressed the expression of catabolic genes in the presence of TNF-α in rat NP cells. (f, g) Western blotting (f) and subsequent densitometric analyses (g) demonstrated the role of NLRP3 knockdown on the LC3 II/LC3 I ratio and P62 expression level under TNF-α stimulation in rat NP cells. The data are presented as the mean ± standard deviation and were analyzed from three independent experiments. *p < 0.05
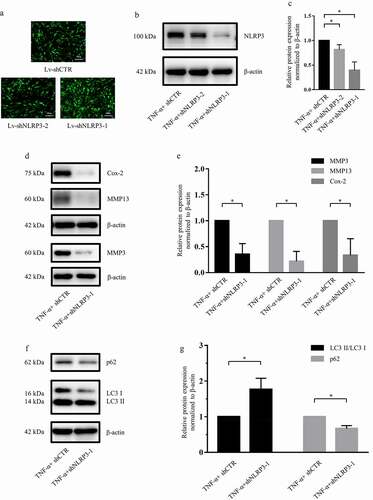
Figure 6. Atorvastatin and NLRP3 inhibition suppressed the activity of NF-κB signaling in rat NP cells. (a) Western blotting analysis revealed that atorvastatin inhibited the nuclear translocation of p65 induced by TNF-α. (b, c) Western blotting (b) and subsequent densitometric analyses (c) suggested that NLRP3 inhibition by MCC950 suppressed TNF-α-mediated p65 phosphorylation and p-p65/p65 ratios. (d) Immunofluorescence staining showed that the nuclear translocation of p65 induced by TNF-α was repressed by atorvastatin and MCC950 in rat NP cells (magnification: ×500, scale bar = 20 μm). (e) The ratio of cells with p65 located in the nucleus was analyzed and plotted. The data are presented as the mean ± standard deviation and were analyzed from three independent experiments. *p < 0.05
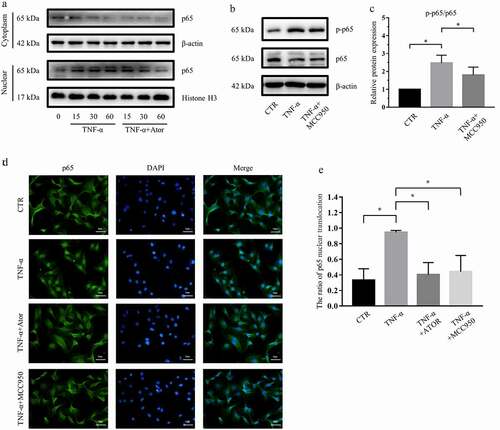
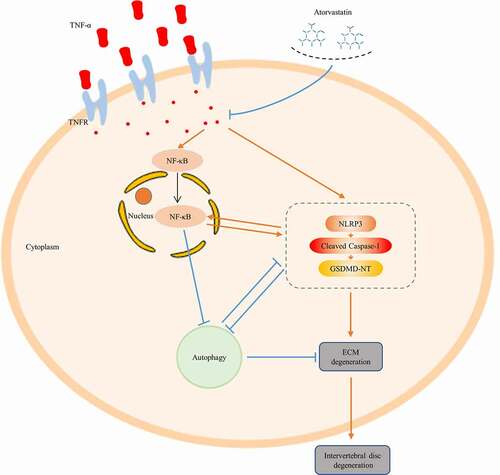
Figure 7. Schematic graph. Atorvastatin inhibits matrix degradation induced by TNF-α, and atorvastatin suppresses NF-κB signaling, while NF-κB signaling inhibition suppresses NLRP3 inflammasome activity and induces autophagy in rat NP cells. NLRP3 inhibition suppresses TNF-α-induced NF-κB signaling activation and induces autophagy. The present study further demonstrates the crosstalk among NLRP3 inflammasome activity, autophagy and NF-κB signaling