Figures & data
Figure 1. (a) Slider-crank mechanism; (b) Eccentric cam mechanism.
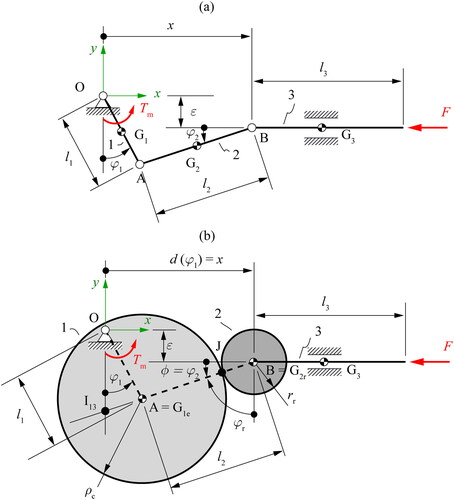
Figure 2. FBD for each link of a slider-crank mechanism.
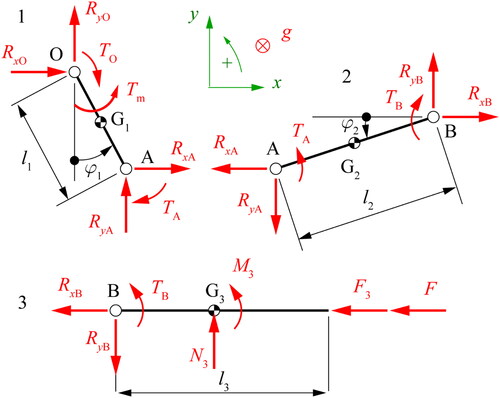
Table 1. Dynamic variables and parameters for the slider-crank mechanism.
Table 2. Geometric parameters for the eccentric cam mechanism.
Figure 3. Geometric parameters for an eccentric cam mechanism.
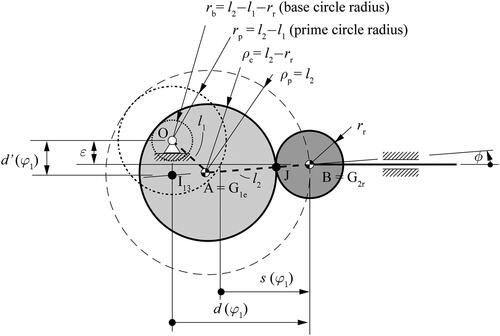
Figure 4. FBD for each link of an eccentric cam mechanism.
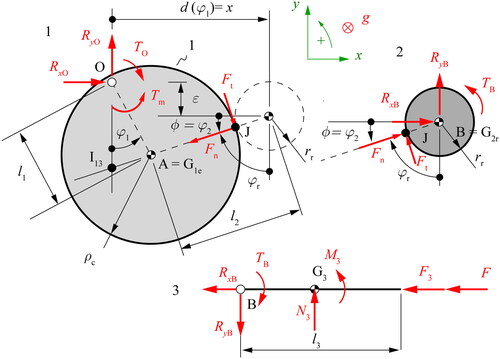
Table 3. Dynamic variables and parameters for the eccentric cam mechanism.
Table 4. Required parameters for the numerical examples.
Figure 5. (a) Transmission efficiency of motion; (b) Linear acceleration of the slider and the follower.
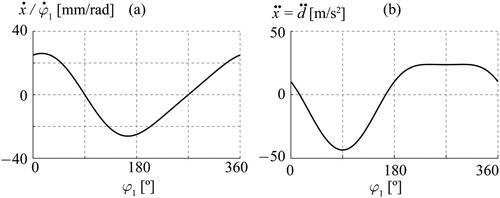
Figure 6. Rollers and rod: (a) Angular velocities; (b) Angular accelerations.
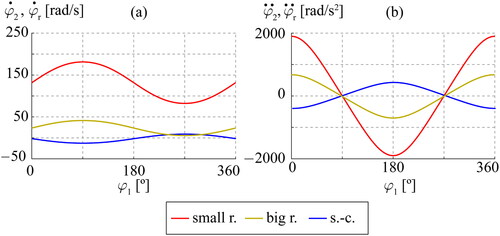
Figure 7. Internal reactions for each pair: (a) Slider-crank; (b) Eccentric cam with small roller radius; (c) Eccentric cam with big roller radius; (d) Transmission efficiency of force.
Table 5. Required parameters for traction coefficient (Masjedi and Khonsari Citation2015).
Figure 8. Energy loss per cycle.
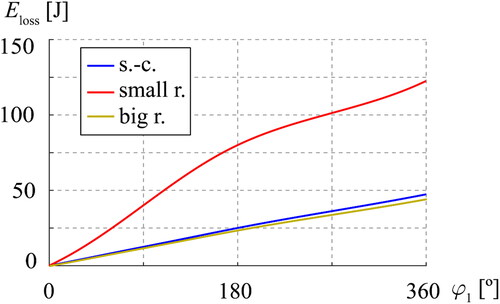
Figure 9. Energy loss per cycle workspaces.
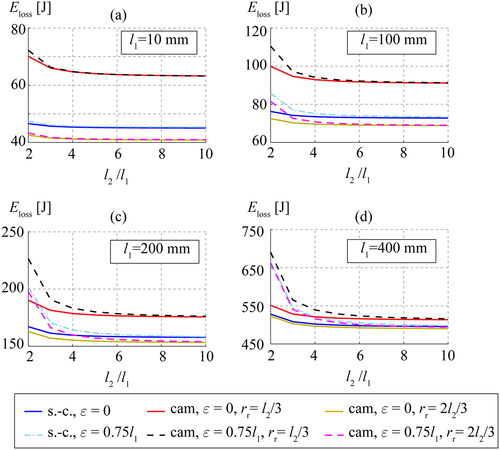
Figure 10. Relative differences in energy loss per cycle with regard to the most efficient case.
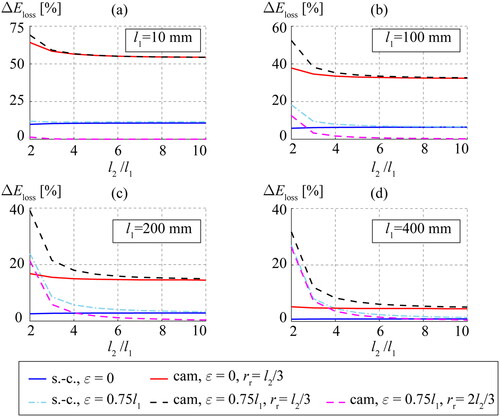
Figure 11. Test stand indicating the shared common elements.
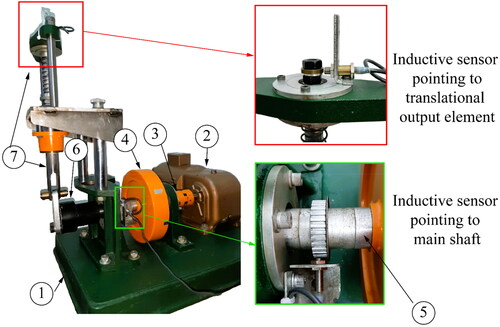
Table 6. Test stand specifications of the shared components.
Figure 12. (a) Slider-crank; (b) Eccentric cam with small roller radius; (c) Eccentric cam with big roller radius.
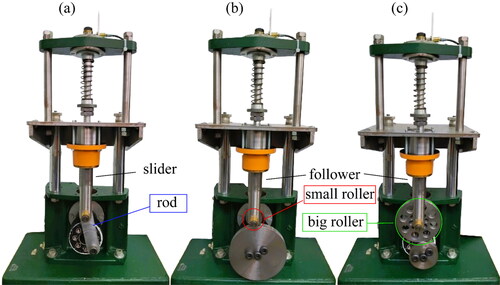
Figure 13. Test results: (a) Eccentric cam with small roller radius; (b) Eccentric cam with big roller radius; (c) Slider-crank.
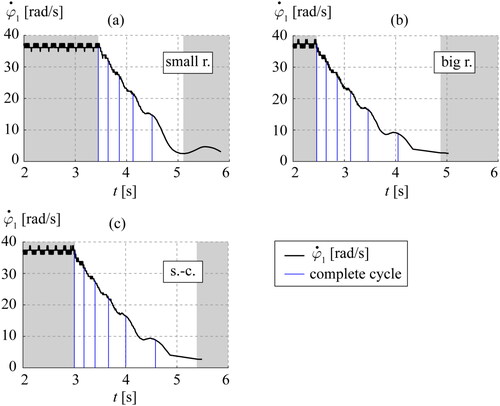
Figure 14. Inertia reduced to
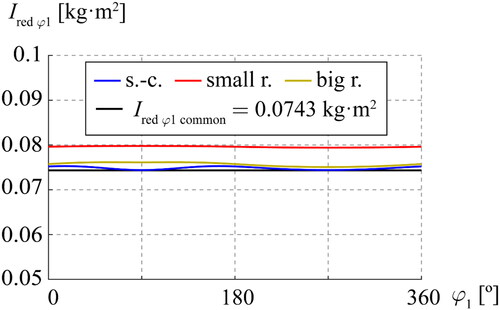
Figure 15. Experimental comparison of energy loss per cycle.
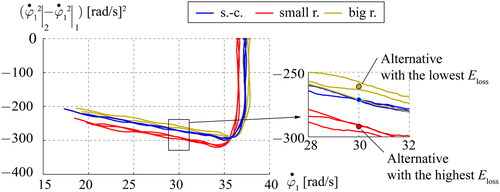
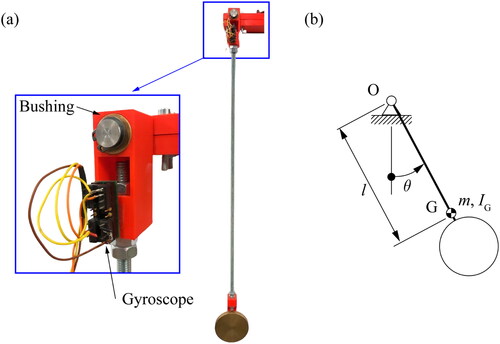
Figure A1. Bushing oscillating system: (a) Base input test; (b) Schematic representation.
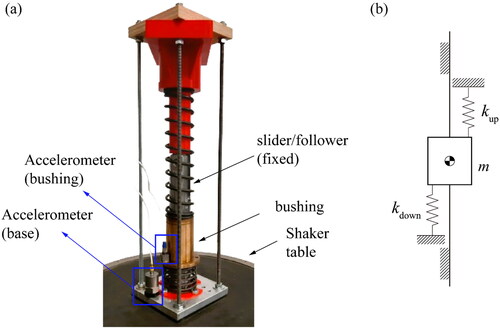
Figure A2. (a) Pendulum system; (b) Schematic representation.