763
Views
68
CrossRef citations to date
0
Altmetric
ORIGINAL RESEARCH

Increased Airway Granzyme b and Perforin in Current and Ex-Smoking COPD Subjects

, , , &
Pages 179-187 | Published online: 02 Jul 2009

Figures & data

Table 1 Demographic characteristics of the population studied and BAL leucocyte counts

Figure 1 Representative flow cytometric dot plots of granzyme-b and perforin expression by NK cells and T-cells. (A,B) Peripheral blood-derived NK cells were identified in R1 as staining brightly with CD56PC5 (not shown). Subsequent analysis was carried out on cells from R1. NK cells expressing (A) granzyme-b or (B) perforin were identified in quadrant 1 (Q1) by negative staining with CD3 (ie. excluding NKT cells) and bright staining with Mabs to granzyme-b or perforin. Data was expressed as a percentage of total CD3 negative NK cells. (C,D) Peripheral blood-derived T-cells were identified in R1 as staining brightly with CD3PC5 (not shown). Subsequent analysis was carried out on cells from R1. T-cells expressing granzyme-b or perforin were identified by bright staining with Mabs to (C) granzyme-b or (D) perforin (Q1 +Q2). Data was expressed as a percentage of total CD3 T-cells and as a percentage of CD8+ T-cells (Q2/Q2+Q3). (E,F) BAL-derived T-cells. Analysis of BAL was performed as described for blood.
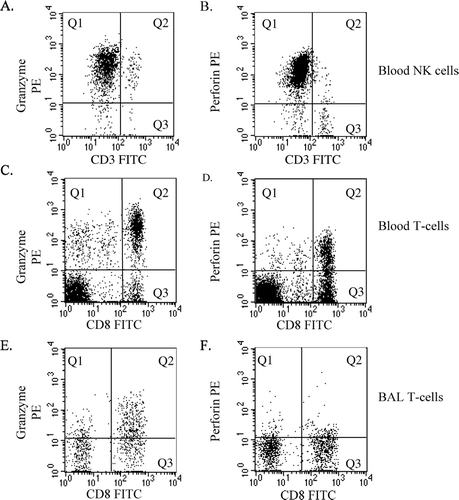
Figure 1 Representative flow cytometric dot plots of granzyme-b and perforin expression by NK cells and T-cells. (A,B) Peripheral blood-derived NK cells were identified in R1 as staining brightly with CD56PC5 (not shown). Subsequent analysis was carried out on cells from R1. NK cells expressing (A) granzyme-b or (B) perforin were identified in quadrant 1 (Q1) by negative staining with CD3 (ie. excluding NKT cells) and bright staining with Mabs to granzyme-b or perforin. Data was expressed as a percentage of total CD3 negative NK cells. (C,D) Peripheral blood-derived T-cells were identified in R1 as staining brightly with CD3PC5 (not shown). Subsequent analysis was carried out on cells from R1. T-cells expressing granzyme-b or perforin were identified by bright staining with Mabs to (C) granzyme-b or (D) perforin (Q1 +Q2). Data was expressed as a percentage of total CD3 T-cells and as a percentage of CD8+ T-cells (Q2/Q2+Q3). (E,F) BAL-derived T-cells. Analysis of BAL was performed as described for blood.

Figure 2 Intracellular expression of granzyme-b and perforin in peripheral blood derived T-cells. Expression of granzyme-b and perforin was quantified on A. CD3+ T-cells and B. CD8+ T-cells by flow cytometry. Note significantly increased expression of granzyme-b and perforin in current- (COPD current smokers, n = 30) and ex- (COPD ex-smokers, n = 30) smokers with COPD but no changes in asymptomatic smokers (Smokers, n = 18) compared to never-smokers (n = 30). *significant increase (p ≤ 0.05) in granzyme-b compared to control; **(p ≤ 0.05) significant increase in perforin compared to never-smokers. Box plots shows median, quartiles, and ranges.
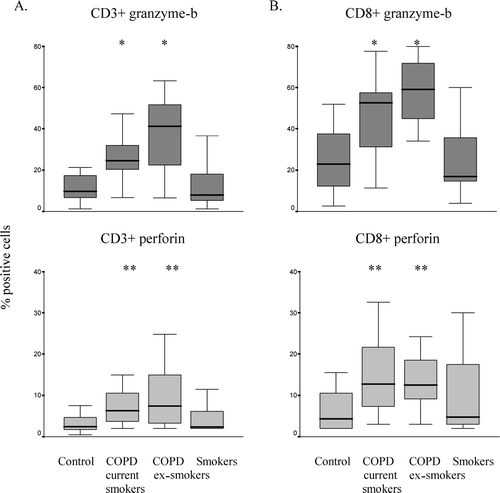
Figure 2 Intracellular expression of granzyme-b and perforin in peripheral blood derived T-cells. Expression of granzyme-b and perforin was quantified on A. CD3+ T-cells and B. CD8+ T-cells by flow cytometry. Note significantly increased expression of granzyme-b and perforin in current- (COPD current smokers, n = 30) and ex- (COPD ex-smokers, n = 30) smokers with COPD but no changes in asymptomatic smokers (Smokers, n = 18) compared to never-smokers (n = 30). *significant increase (p ≤ 0.05) in granzyme-b compared to control; **(p ≤ 0.05) significant increase in perforin compared to never-smokers. Box plots shows median, quartiles, and ranges.
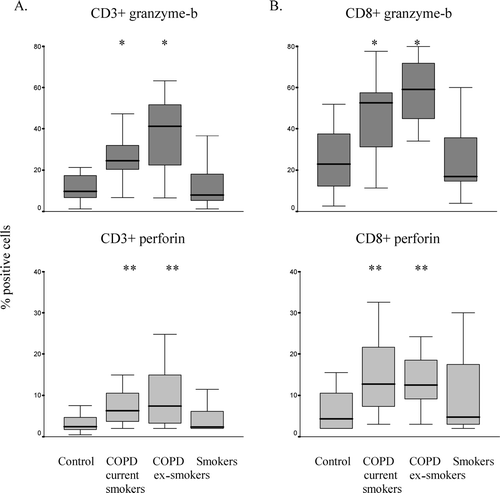
Figure 3 Intracellular expression of granzyme-b and perforin in BAL derived T-cells. Expression of granzyme-b and perforin was quantified on A. CD3+ T-cells and B. CD8+ T-cells by flow cytometry. Note significantly increased expression of granzyme-b and perforin in current- (COPD current smokers, n = 15) and ex- (COPD ex-smokers, n = 15) smokers with COPD and asymptomatic smokers (Smokers, n = 10) compared to never-smokers (n = 12). *significant increase (p ≤ 0.05) in granzyme-b compared to never-smokers; **(p ≤ 0.05) significant increase in perforin compared to never-smokers. Box plots shows median, quartiles, and ranges.

Figure 3 Intracellular expression of granzyme-b and perforin in BAL derived T-cells. Expression of granzyme-b and perforin was quantified on A. CD3+ T-cells and B. CD8+ T-cells by flow cytometry. Note significantly increased expression of granzyme-b and perforin in current- (COPD current smokers, n = 15) and ex- (COPD ex-smokers, n = 15) smokers with COPD and asymptomatic smokers (Smokers, n = 10) compared to never-smokers (n = 12). *significant increase (p ≤ 0.05) in granzyme-b compared to never-smokers; **(p ≤ 0.05) significant increase in perforin compared to never-smokers. Box plots shows median, quartiles, and ranges.

Figure 4 Soluble granzyme-b levels in BAL. Granzyme-b levels were measured by ELISA in BAL. Note significantly increased expression of granzyme-b in current- (COPD current smokers, n = 10), ex- (COPD ex-smokers, n = 13) smokers with COPD but no changes in asymptomatic smokers (Smokers, n = 11) compared to never-smokers (n = 24). *significant increase (p ≤ 0.05) in granzyme-b compared to never-smokers. Box plot shows median, quartiles, and ranges.
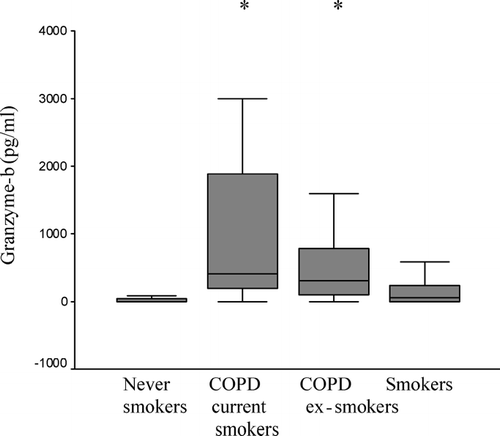
Figure 4 Soluble granzyme-b levels in BAL. Granzyme-b levels were measured by ELISA in BAL. Note significantly increased expression of granzyme-b in current- (COPD current smokers, n = 10), ex- (COPD ex-smokers, n = 13) smokers with COPD but no changes in asymptomatic smokers (Smokers, n = 11) compared to never-smokers (n = 24). *significant increase (p ≤ 0.05) in granzyme-b compared to never-smokers. Box plot shows median, quartiles, and ranges.

Figure 5 Correlation between T-cell granzyme-b levels in BAL and bronchial epithelial apoptosis. Apoptosis was measured in bronchial brushing derived epithelial cells by 7AAD staining. Note good correlation between intracellular granzyme-b in BAL-derived T-cells and apoptosis of bronchial epithelial cells.
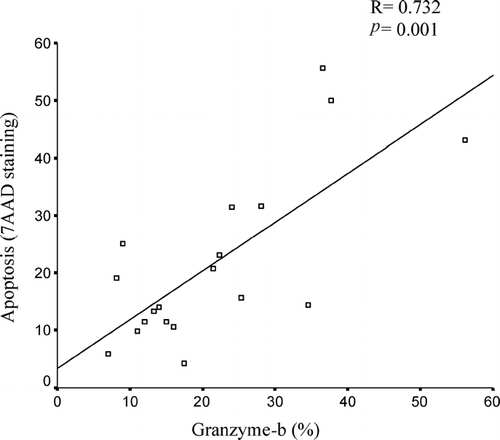
Figure 5 Correlation between T-cell granzyme-b levels in BAL and bronchial epithelial apoptosis. Apoptosis was measured in bronchial brushing derived epithelial cells by 7AAD staining. Note good correlation between intracellular granzyme-b in BAL-derived T-cells and apoptosis of bronchial epithelial cells.

Reprints and Corporate Permissions

Please note: Selecting permissions does not provide access to the full text of the article, please see our help page How do I view content?

To request a reprint or corporate permissions for this article, please click on the relevant link below:

Academic Permissions

Please note: Selecting permissions does not provide access to the full text of the article, please see our help page How do I view content?

Obtain permissions instantly via Rightslink by clicking on the button below:

If you are unable to obtain permissions via Rightslink, please complete and submit this Permissions form. For more information, please visit our Permissions help page.