Figures & data
Table 1 Demographics and spirometry values of the four groups
Table 2 Differential cell count of white blood cells in BAL fluid, given in number cells/ml*104
Figure 1 Lymphocytes derived from BAL fluid were gated according to forward and side scatter (FSC/SSC) and screened by flow cytometry for the presence of CD4+CD25+ and CD4+CD25bright cells. Representative FACS stainings from one individual with COPD and one control subject are shown. To the right of each figure, percentages of bright, dim and negative population of CD4+ and CD8+ cells are shown.
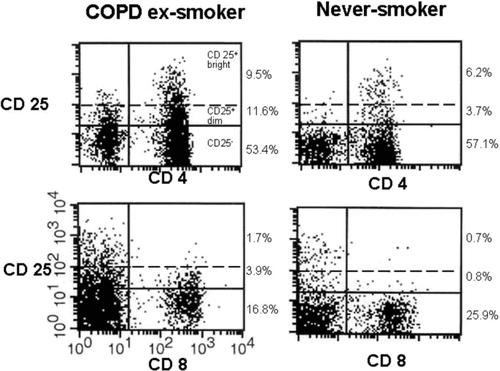
Figure 2 Flow cytometry of never-smokers (NS), smokers (S) and COPD. CD4, CD8 and TCR gamma delta are given as percent of CD3. Among the COPD group • indicates ex-smokers, whilst Δ indicates smokers. A p-value below 0.017 is considered significant. Significance levels are noted as * p < 0.017, ** p < 0.01 and *** p < 0.001.
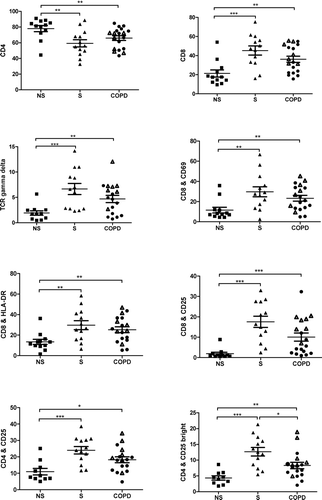
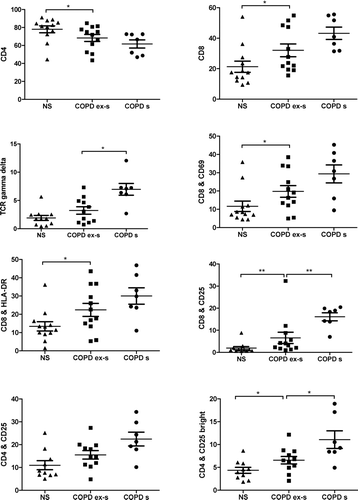
Figure 3 Sub-groups analysis of never-smokers (NS), COPD ex-smokers (COPD ex-s) and COPD smokers (COPD s). CD4, CD8 and TCR gamma delta are given as percent of CD3. A p-value below 0.05 is considered significant. Significance levels are noted as * p < 0.05 and ** p < 0.01.