
Figures & data
Figure 1 Patients with COPD have lung inflammation that affects all organs of the body. Reproduced with permission from Boschetto et al. (Citation38) (License Number: 4467500227437, License date Nov 14, 2018. Licensed Content Publisher: John Wiley and Sons. Licensed Content Publication: Respirology)
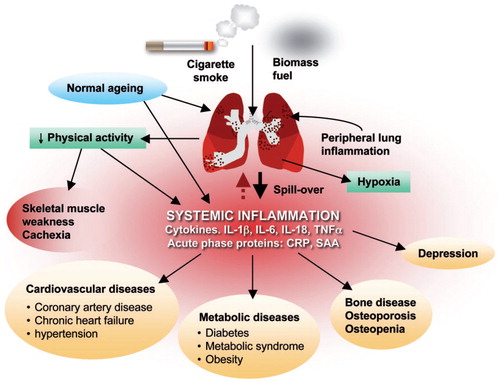
Figure 2 The spectrum of support available for patients with COPD. Reproduced with permission from Spruit et al. (Citation1). Reprinted with permission of the American Thoracic Society. Copyright© 2018 American Thoracic Society (Citation1). The American Journal of Respiratory and Critical Care Medicine is an official journal of the American Thoracic Society.
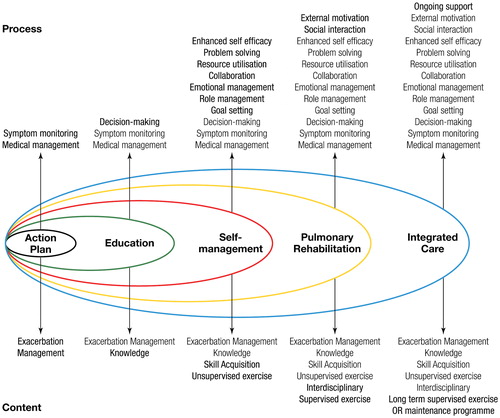
Figure 3 Pathophysiology of exercise impairment in COPD. The three most important mechanisms of exercise limitation in COPD are (1) Gas Exchange Inefficiency, (2) Muscle Deconditioning and (3) Dynamic Hyperinflation. Adapted from Wasserman et al. (Citation54)
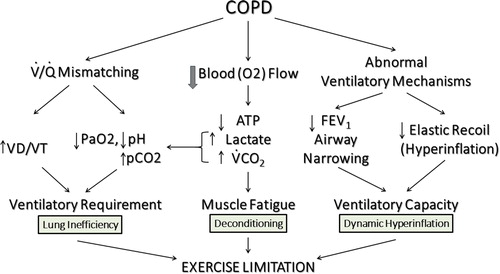
Figure 4 Pre- and Post-Bronchodilator spirometry of a patient with severe COPD. Pre/Post Bronchodilator responses indicating severe (0.94 L, 30% of predicted) reduction in FEV1 and a very low FEV1/FVC (35%). There is a bronchodilator response that meets ATS/ERS criteria (>12% and 200 mL in either FEV1 or FVC). Further lung function results were: The total lung capacity (TLC) is normal (6.57 L or 96% predicted) and the diffusing capacity for carbon monoxide (DLco) is 107 mL/min/mmHg or 37% of predicted (not shown). Reference values for spirometry were according to Hankinson (Citation55), for the lung volumes were according to the ECSC (Citation56) and for the diffusion capacity by Miller et al. (Citation57). Reprinted with permission of the American Thoracic Society. Copyright© 2018 American Thoracic Society (Citation57). American Review of Respiratory Disease is an official journal of the American Thoracic Society.
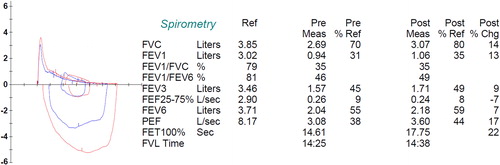
Figure 5 Progressive ramp-incremental test on the cycle ergometer on a patient with severe COPD and dynamic hyperinflation. Panel 1 (top left), is oxygen uptake (VO2), carbon dioxide output (VCO2), and work rate as a function of time (3 min of rest, 3 min of unloaded cycling, and 12 min of exercise with 5 W/min increments, followed by 2 min of recovery). Panel 2 (top middle), is heart rate and oxygen pulse (O2P) as a function of time. Panel 3 (top right), is heart rate and VCO2 as a function of VO2. This panel is used to identify the lactic acidosis threshold using the V-slope method (Citation58) (in this example, approximately 0.85 L/min). Panel 4 (middle left), ventilatory equivalents for oxygen (VE/VO2) and carbon dioxide (VE/VCO2) as well as the VD/VT (calculated using the transcutaneously determined PaCO2) are displayed. The left y axis is the ventilatory equivalents and the right y axis is the transcutaneous VD/VT (VDVTc, green filled circles). VD/VT is markedly elevated throughout exercise with a nadir of 0.44. In panel 5 (center graph), the ventilation and blood pressures are displayed. The patient had an end-exercise blood pressure of 200/100 mmHg. In panel 6 (middle, right), ventilation as a function of VCO2 is displayed. The VE/VCO2 slope is approximately 26 L/min. Panel 7 (bottom left) displays the end tidal oxygen (PETO2), carbon dioxide (PETCO2), the oxygen saturation (Sat), and the transcutaneous pCO2 (TcPCO2). End tidal and transcutaneous CO2 are markedly elevated in this graph (56 and 48 mmHg, respectively). Oxygen saturation was progressively decreasing during exercise to a nadir of ∼85%. Panel 8 (bottom center), is the respiratory exchange ratio (RER) as a function of time. Panel 9 (bottom right), displays inspiratory capacity (golden stars) falling as a function of increasing ventilation. As such respiratory rate increases to almost 40 at end exercise with a tidal volume that does not exceed 1 liter. Finally, the exercise ventilation is essentially the MVV from 40 X FEV1.
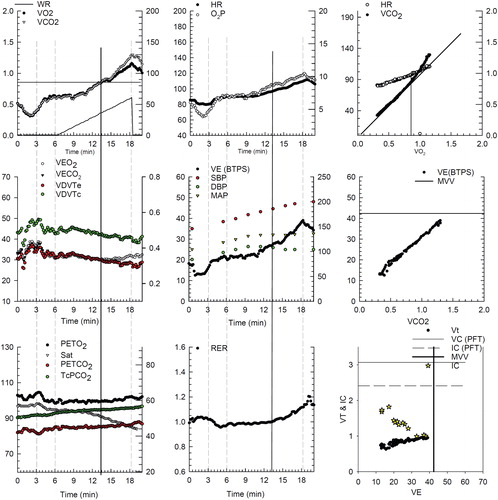
Figure 6 Dynamic hyperinflation during progressive exercise in a patient with COPD. This patient is the same patient as and . Panel 1 (early exercise) The flow volume loop (red line) compared to the resting flow volume loop (blue line). Total lung capacity (TLC) is on the left, residual volume (RV) is on the right. Panel 2 (mid exercise) The flow volume loops have moved to the left (towards TLC) consistent with dynamic hyperinflation. Panel 3 (peak exercise) The entire flow volume loop is shifted leftward with a marked reduction in expiratory flow compared to inspiratory flow. Of note, both the peak spontaneous expiratory and inspiratory flow rates at peak exercise approach that were obtained pre-exercise during the resting spirometry. All of these changes begin to resolve in early recovery (panel 4).
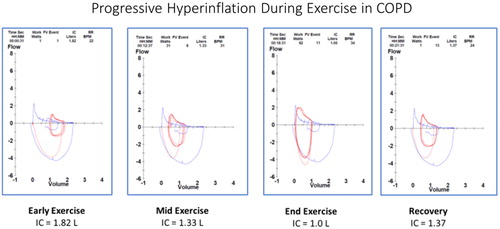
Figure 7 Breath-by-breath representation of the dynamic changes in the rectangular area ratio (RAR) during exercise. At the start of ramp pattern exercise in the same patient as in , the RAR value is consistently <0.5 even at rest. However, as exercise progresses it falls below 0.4, indicating severe airflow obstruction that is associated with dynamic hyperinflation (decreased inspiratory capacity and increasing end expiratory lung volumes, EELV) (compare with and ).
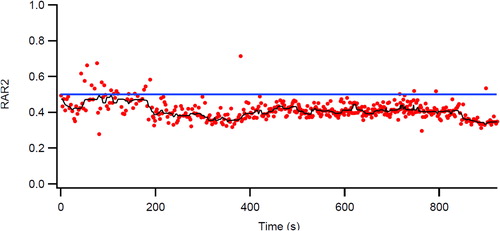
Figure 8 Changes in physiologic responses to identical exercise tasks induced by two different intensity training strategies in patients with COPD (high and low work rate training). Original Legend to Figure: Changes in physiologic responses to an identical exercise task (high constant work rate test0 produced by two exercise training strategies in patients with COPD. Left panel. High work rate training group (n = 11) Right panel. Low work rate training group (n = 8). Reprinted with permission of the American Thoracic Society. Copyright © 2018 American Thoracic Society (Citation25). American Review of Respiratory Disease is an official journal of the American Thoracic Society.
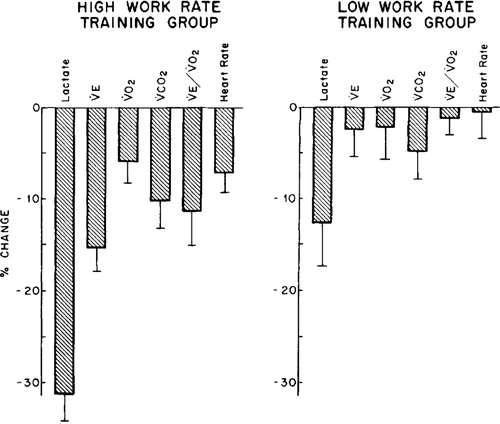
Table 1. CPET variables on cycle ergometry that change with careful study of pulmonary rehabilitation (PR) data from Casaburi (Citation25, Citation47) and Emtner (Citation27).
Figure 9 Morphological and structural alterations reported in limb muscles in patient with COPD. Reprinted with permission of the American Thoracic Society. Copyright © 2018 American Thoracic Society. Maltais et al. (Citation11).
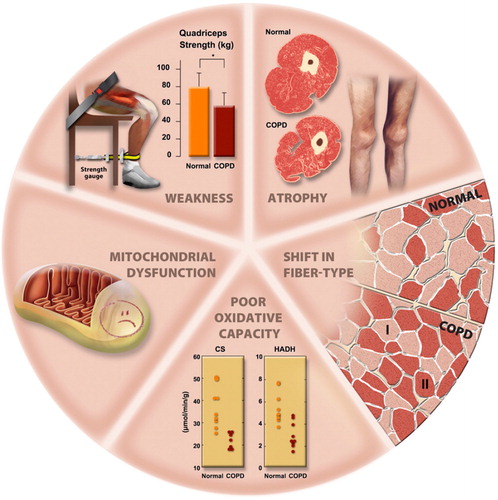
Table 2. CPET vs 6MW in COPD PR—pro/con table.
Table 3. Minimal clinically important differences, MCID for CPET and PR