
Figures & data
Table 1. Baseline characteristics of patients admitted with a clinical exacerbation of chronic obstructive lung disease (COPD).
Figure 1. Exacerbation rate. Overview per BMI class of readmissions per year over a five year period following a hospitalization for COPD exacerbation. BMI = Body Mass Index. COPD = Chronic Obstructive Lung Disease.
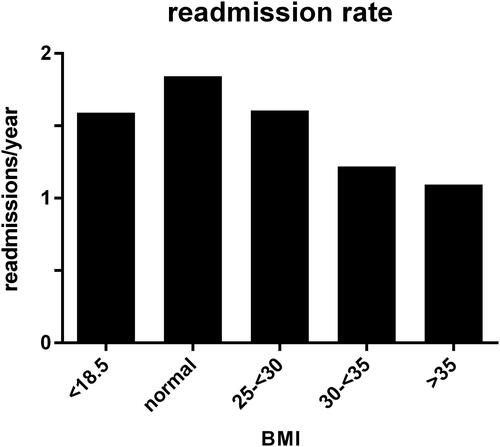
Figure 2. Time to readmission. Survival graph plotting percentage of patients free from readmission over a five year period following a hospitalization for an exacerbation of Chronic Obstructive Lung Disease (COPD). Patients are categorized according to Body Mass Index (BMI) class.
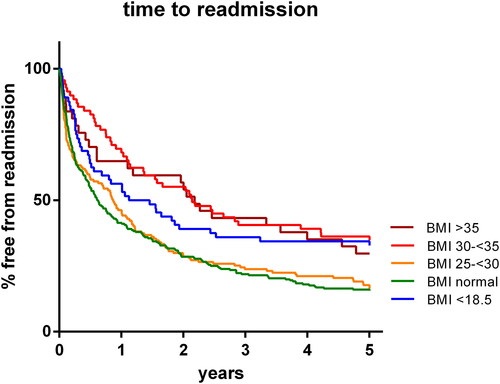
Figure 3. 5-year survival. Survival graph plotting survival over a five year period following a hospitalization for an exacerbation of Chronic Obstructive Lung Disease (COPD). Patients are categorized according to Body Mass Index (BMI) class.
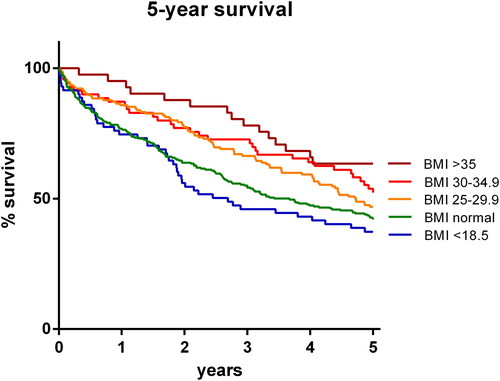
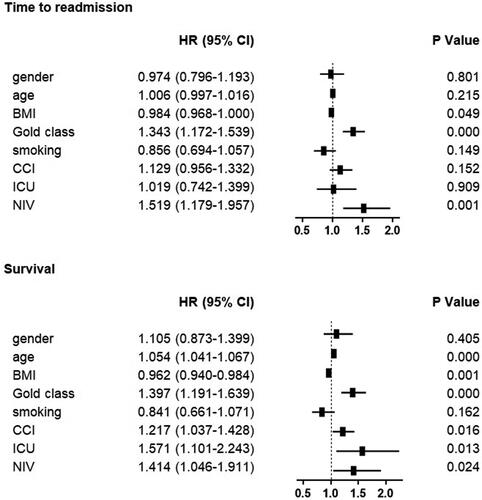
Figure 4. Cox regression analysis of time to readmission and survival. Hazard ratios represent increased chance of readmission or death, respectively. CI=confidence interval. BMI = Body Mass Index. CCI = Charlson comorbidity index. ICU = Intensive Care Unit. NIV = non-invasive ventilation. Yrs = Years. FEV1 = Forced Expiratory Volume in 1 second. FVC = Forced Vital Capacity.
Data availability statement
The data that support the findings of this study are available on request from the corresponding author, MDK.