Figures & data
Figure 1. Flowchart of the selection of studies included in the meta-analysis.
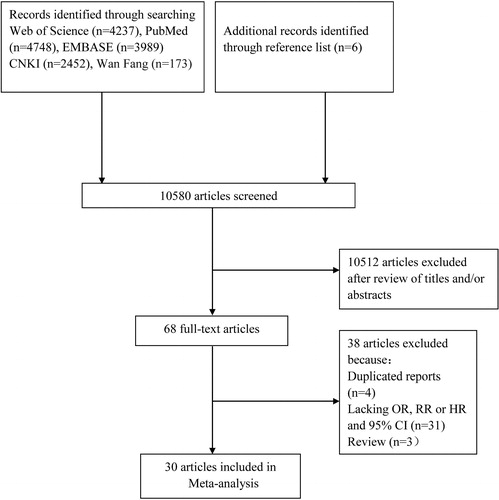
Table 1. Subgroup analysis of underweight and risk of COPD.
Figure 2. Forest plot of the odds ratio (ORs) with corresponding 95% confidence intervals (CIs) of the association between underweight and risk of COPD.
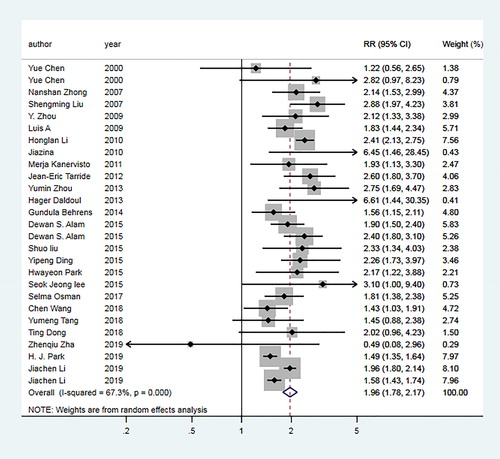
Figure 3. Forest plot of the odds ratio (ORs) with corresponding 95% confidence intervals (CIs) of the association between overweight and risk of COPD.
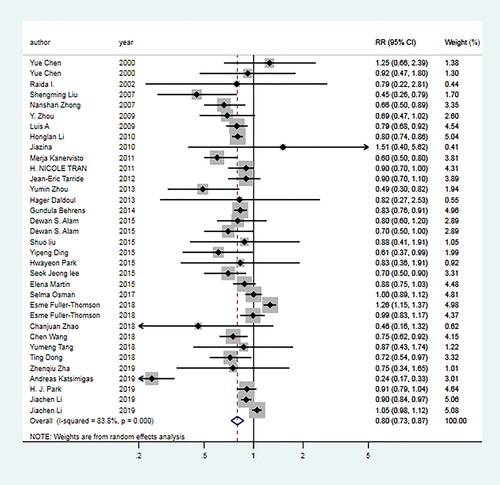
Figure 4. Forest plot of the odds ratio (ORs) with corresponding 95% confidence intervals (CIs) of the association between obesity and risk of COPD.
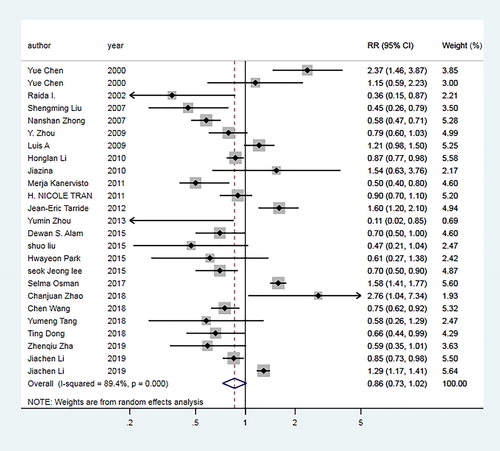
Table 2. Subgroup analysis of overweight and risk of COPD.
Table 3. Subgroup analysis of obesity and risk of COPD.
Figure 5. Influence analysis of the odds ratio (ORs) with corresponding 95% confidence intervals (CIs) of the association between BMI and risk of COPD. (a) underweight. (b) overweight. (c) obesity.
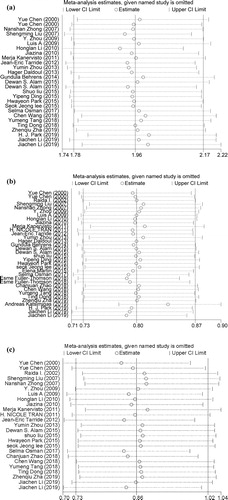
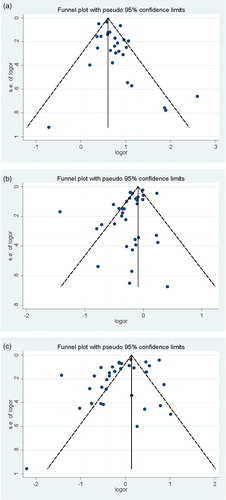
Figure 6. Funnel plot of the odds ratio (ORs) with corresponding 95% confidence intervals (CIs) of the association between BMI and risk of COPD. Each dot represents a different study. (a) Underweight, (b) overweight, (c) obesity.