Figures & data
Figure 1. Flow chart of the screening process for the selection of eligible participants.
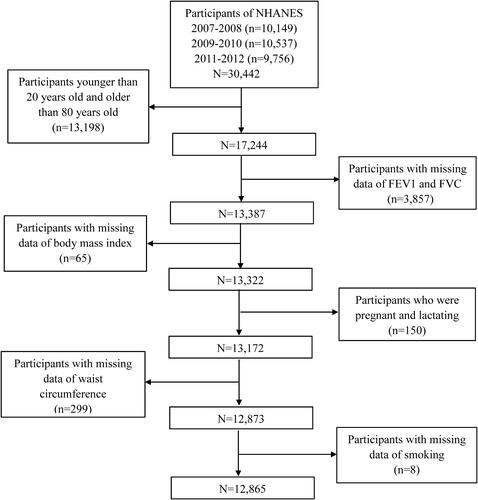
Table 1. Characteristics of participants by airflow obstruction, NHANES 2007–2012, adults ≥20 years and ≤80 years of age.
Table 2. Weighted odds ratios (95% confidence intervals) of airflow obstruction across body mass index and smoking, NHANES 2007–2012 (N = 12,865).
Table 3. Weighted odds ratios (95% confidence intervals) of airflow obstruction across body mass index, stratified by sex and smoking, NHANES 2007–2012 (N = 12,865).
Table 4. Weighted odds ratios (95% confidence intervals) of airflow obstruction across abdominal obesity and body mass index, NHANES 2007–2012 (N = 12,865).
Table 5. Weighted odds ratios (95% confidence intervals) of airflow obstruction across abdominal obesity and stratified by sex and smoking, NHANES 2007–2012 (N = 12,865).
Table 6. Interaction effects between underweight and smoking.
Table 7. Interaction effects between abdominal obesity and smoking.
Figure 2. Dose-response relationship between BMI and the ORs of airflow obstruction (FR). The solid line and dashed line represent the estimated ORs and their 95% confidence intervals. BMI, body mass index; FR, fixed ratio; LLN, lower limit of normal; OR, odds ratio.
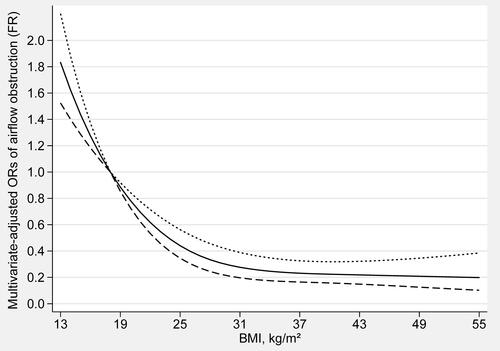
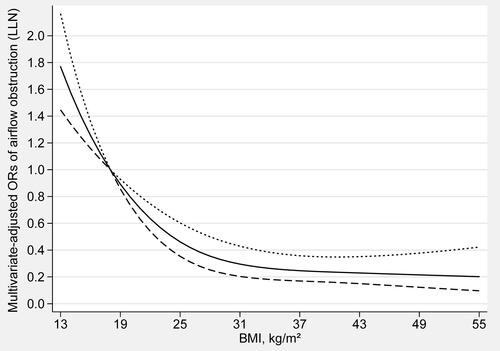
Figure 3. Dose-response relationship between BMI and the ORs of airflow obstruction (LLN). The solid line and dashed line represent the estimated ORs and their 95% confidence intervals. BMI, body mass index; FR, fixed ratio; LLN, lower limit of normal; OR, odds ratio.