
Figures & data
Figure 1. Network pharmacology and bioinformatics analysis to screen Panax notoginseng-related target genes for COPD regulation.
Note: (A) Venn diagram showing the intersection of Panax notoginseng’s related targets and COPD disease-related genes. (B) Interaction network diagram of proteins encoded by the 8 candidate target genes. (C) Bar chart showing the degree ranking of the 8 candidate target genes. (D) Importance ranking of the 8 candidate target genes in COPD as shown by the Phenolyzer database.
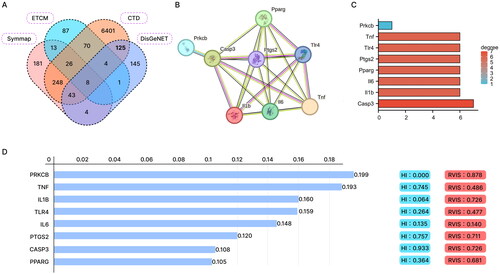
Figure 2. GO and KEGG enrichment analysis of candidate target genes.
Note: (A-C) GO function analysis shows the enrichment of the 8 candidate target genes in BP, MF, and CC. (D) KEGG pathway enrichment analysis of the 8 candidate target genes.
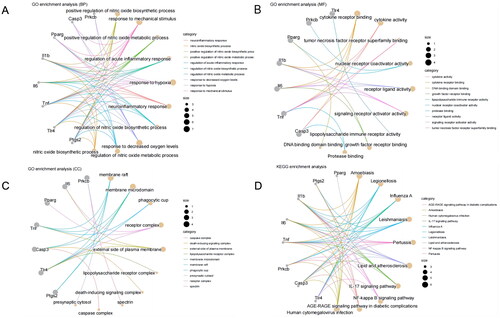
Figure 3. Weight changes of rats in different groups over time.
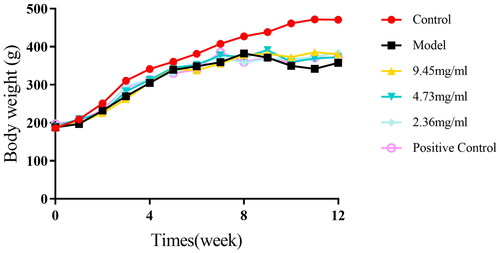
Figure 4. HE staining and lung function measurements were obtained for the lung tissue of each group of rats.
Note: A: HE staining results (10 × 10) of the lung tissue in each group of rats; B: Lung function (FEV0.2/FVC%, PEF) measurements in each group of rats; compared to the Control group, *P < 0.01, P < 0.05; compared to the Model group, ##p < 0.01, #p < 0.05.
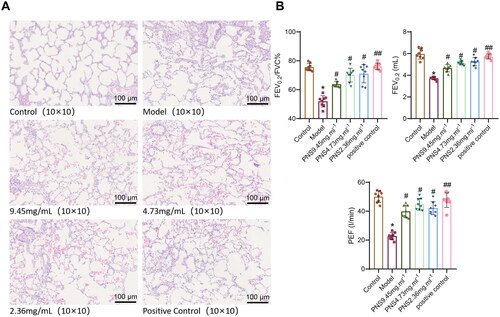
Figure 5. PNS’s effect on pulmonary vascular remodeling induced by COPD in rats.
Note: (A) Victoria + VG staining results of lung tissues from rats in each group (10 × 10). (B) Proportion of elastic fibers in lung tissues from rats in each group. (C) Proportion of collagen fibers in lung tissues from rats in each group. Compared to Control, **p <0.01, *p <0.05; compared to Model, ##p <0.01, #p <0.05.
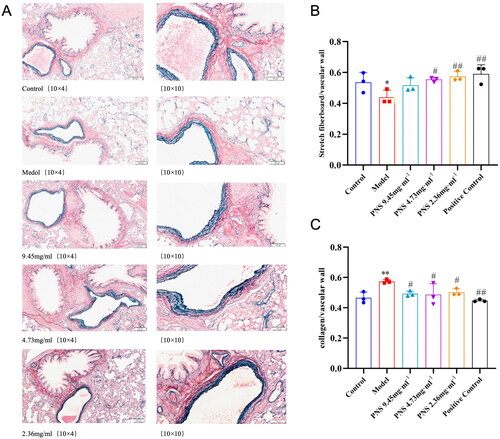
Figure 6. PNS affects the expression of related inflammatory factors and adhesion molecules in COPD rats.
Note: (A–C) ELISA detection of TNF-α, IL-8, and IL-1β levels in the serum of rats from each group. (D–E) ELISA detection of ICAM-1 and SELE levels in the serum of rats from each group. (F–G) RT-qPCR detection of ICAM-1 and SELE mRNA expression levels in lung tissues from rats in each group. Compared to Control, **p <0.01, *p <0.05; compared to Model, ##p <0.01, #p <0.05.
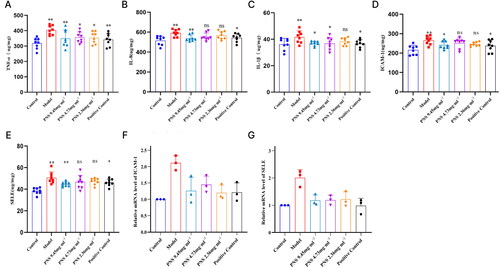
Figure 7. PNS’s regulation of TLR4/NF-κB/HIF-1α/VEGF pathway factor expression in COPD rats.
Note: (A) ELISA detection of VEGF concentration in the serum of rats from each group.
(B-D) RT-qPCR detection of TLR4, NF-κB, HIF-1α, and VEGF mRNA expression levels in lung tissues from rats in each group. Compared to Control, **p <0.01, *p <0.05; compared to Model, ##p <0.01, #p <0.05.
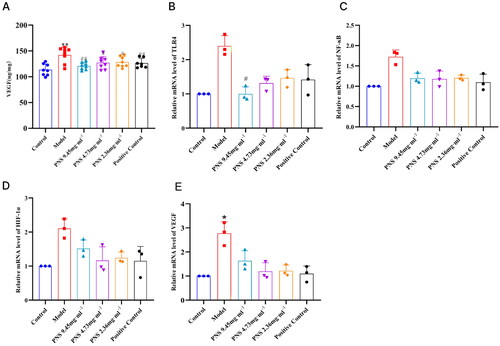
Figure 8. Changes in TLR4/NF-κB/HIF-1α/VEGF protein expression in lung tissues from rats in each group.
Note: (A) Western blot detection of TLR4, MyD88, NF-κB, HIF-1α, and VEGF protein expression in lung tissues from rats in each group. (B-F) Protein expression charts of TLR4, MyD88, NF-κB, HIF-1α, and VEGF in lung tissues from rats in each group. Compared to Control, **p <0.01, *p <0.05; compared to Model, ##p <0.01, #p <0.05.
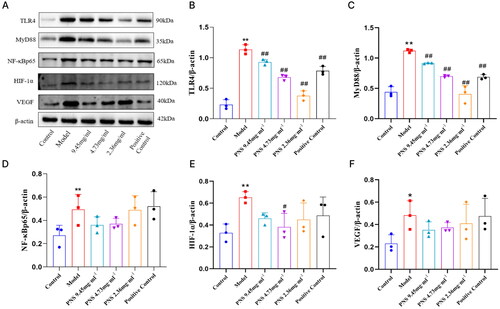
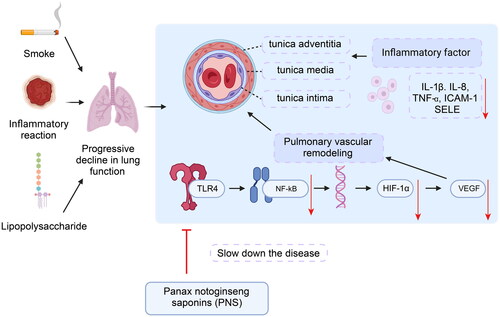
Figure 9. Schematic diagram of PNS’s molecular mechanism in alleviating COPD by regulating the TLR4/NF-κB/HIF-1α/VEGF pathway.
Supplemental Material
Download Zip (6 MB)Data availability statement
The data underlying this article will be shared on reasonable request to the corresponding author.