Figures & data
Figure 1. Cartoon of the E. coli two-hybrid system. The DNA of the reporter gene construct is represented through the black line. λ cI is the repressor protein of the bacteriophage λ, and RNAP the N-terminal domain of the α -subunit of the bacterial RNA-polymerase. The promoter (PlacZ) is a modified form of the lac promoter, which is not inducible by IPTG. “bait” is the protein of interest (in this case the C-terminus of Panx1), while the potential interacting partner is called “target.” The expression of the two reporter genes HIS3 and aadA is induced through the depicted interaction of the two hybrid structures (adapted from Stratagene).
Figure 2. Western-blot analyses of transfected Neuro2A cells. Neuro2A cells were transfected with 400ng DNA and lysed 48 h later. 12 μg protein was loaded in case of double-transfected cells and 8 μg in case of single-transfected cells. Immunodetection was carried out using BD-Living Colors A.v. Peptide antibody (BD Biosciences).
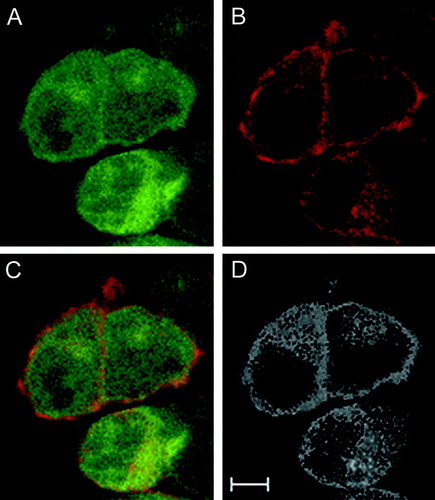
Figure 3. Confocal imaging of Panx1 and Kvβ3. (A) Kvβ3-ECFP, (B) Panx1-EYFP, (C) merged image of (A) and (B). Images represent a single plane derived from a Z-stack recording. (D) Colocalization analyses result using the original RGB-picture (C) and the ImageJ software suite. Scale bar = 5 μ m