Figures & data
Figure 1 Quantification of the expression of uPAR and integrins. uPAR and uPAR-IL-2Rα expressing BAF3 cells were analyzed by fluorescence-associated cell sorting using a polyclonal anti-uPAR IgG. Integrin expression on BAF3 cells was determined using the following mAbs; PS/2 against VLA4, Game 46 against CD18, M1/74 against CD11a, M1/70 against CD11b, MFR5 against VLA5, and 2C9.G2 against β3-integrin.
Figure 2 Localization of uPAR and VLA4 to sites of cell adhesion in uPAR-transfected BAF3 cells. (a) uPAR-BAF3 cells were allowed to adhere to VN- or FN-coated slides and adherent cells were fixed and immunostained with anti-uPAR (rabbit polyclonal) IgG and mAb to VLA4 (PS/2) followed by FITC-coupled anti-mouse IgG or rhodamine-coupled anti-rabbit IgG. Confocal microscopy was used to define the localization of the antigens in 0.2-μ m horizontal serial cross sections of the cells. The top, middle, and bottom sections from adherent cells on VN and FN are shown. Panels in the left column show the localization of uPAR, the middle column VLA4 integrin and the right column show the overlay between both. (b) The fluorescence intensity of uPAR and VLA4 staining on VN- or FN-coated slides was quantified in 0.2-μ m serial sections. Relative fluorescence with anti-uPAR IgG on a VN (ρ) or FN substrate (▴)and anti-VLA4 IgG on a VN (□) or FN substrate (▪ is shown. Bar = 10 μ m.
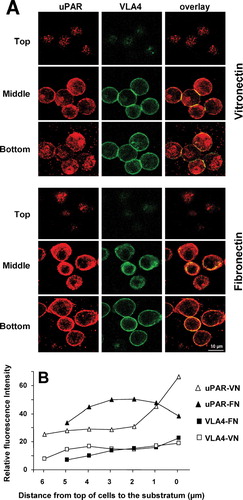
Figure 3 Determination of cell-substrate contact area by interference reflection microscopy (IRM). Control (a and c) and uPAR transfected (b, d, and f) BAF3 cells were plated onto 2-μ g/mL VN or 10-μ g/mL FN for one hour. After fixation, cells were imaged by phase contrast (a and b) and IRM (c and d). The inserts in (c) and (d) show a magnified view of the boxed area in (c) and (d), respectively. (e) Quantification of cell/surface contact area from IRM images (n > 100 cells). The error bars represent the standard deviation of the measured surface areas. (f) Anti-uPAR immunohistochemistry of the cell from insert in (d). The width of the fields in (a)–(d) corresponds to 85 μ m.
Figure 4 Localization of uPA, uPAR, and β1 integrin to sites of cell adhesion in detergent-insoluble adhesion patches (DIAP) of uPAR-transfected cells. uPAR-BAF3 cells were allowed to adhere to VN- or FN-coated slides. The cells were preincubated with uPA (50 nM), at 37°C for 30 min and washed extensively before addition to the slides. Adherent cells were lysed with 1% Triton X-100 (wt/vol) at 4°C for 60 min, and the material remaining on the plate (DIAP) was fixed with methanol/acetone and immunostained with anti-uPA (rabbit polyclonal), anti-uPAR (rabbit polyclonal) IgG or anti β1 integrin (mAb PS/2) followed by FITC-coupled anti-mouse IgG or rhodamine-coupled anti-rabbit IgG. Bar = 10 μ m.
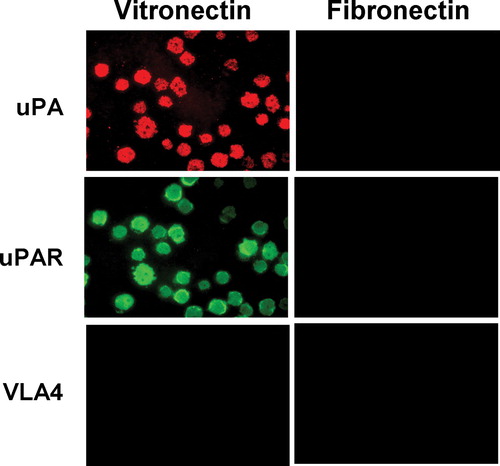
Figure 5 Characterization of the detergent-insoluble adhesion patch (DIAP) of uPAR expressing cells on a VN and FN matrix. (a) uPAR expressing BAF3 were allowed to adhere on a VN- (2 μ g/mL) or an FN- (10 μ g/mL) coated plate in the presence of EDTA (10 mM) where indicated. Thereafter, nonadherent cells were washed away and the adherent cells were lysed with 1% (wt/vol) Triton X-100 at 4°C for 60 min with extensive mixing and this lysate was collected. The lysate was separated into a pellet and supernatant by centrifugation. The plate was extensively washed with fresh solutions of Triton X-100 as above and then the material remaining on the plate (DIAP) extracted with SDS sample buffer. In parallel plates the number of adherent cells was quantified under the different adhesion conditions and this information was used to adjust the volumes of the different extracts. Equivalent amounts of the different fractions were analyzed by Western blotting with antibodies against uPAR. (b) In a similar experiment, as above, n-octyl glucoside (1% wt/vol) was used to lyse the cells adherent on a VN substratum instead of Triton X-100. (c) In a similar experiment to above, instead of adding cells to VN- or FN-coated dishes, pre-prepared Triton X-100 lysates of the same number of growing cells were added to VN- or FN-coated plates. An aliquot of this lysate was also analyzed as a positive control.
Figure 6 Localization of uPAR, F-actin and tyrosine phosphorylated proteins to sites of cell adhesion in uPAR-BAF3 cells. (a) uPAR-BAF3 cells were allowed to adhere to VN- or FN-coated slides. DIAP associated with the substratum were fixed and immunostained with anti-uPAR (rabbit polyclonal) IgG, Phalloidin-conjugated rhodamine and anti-phosphotyrosine IgG followed by FITC-coupled anti-mouse IgG or rhodamine-coupled anti-rabbit IgG. Fluorescence microscopy was used to define the localization of the antigens in DIAP, as indicated in the figure. uPAR-BAF3 cells were preincubated with different concentrations of (b) latrunculin A or (c) genistein at 37 °C for 30 min, as indicated. After extensive washing cell adhesion on VN was determined in the absence (•) or presence of uPA (50nM) (▪) and is expressed as absorbance at 590 nm (mean ± SEM, n = 3).
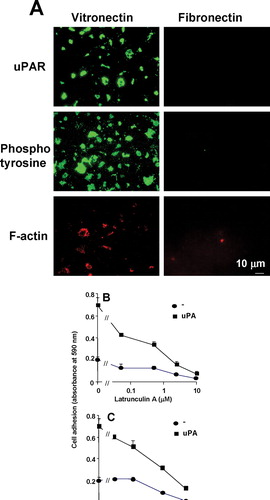
Figure 7 Localization of uPAR to the sites of cell adhesion in uPAR-transfected BAF3 cells with or without the GPI anchor. (a) Non-transfected BAF3 cells (*), cells expressing GPI-anchored uPAR (▪) or cells expressing uPAR as a fusion protein with the transmembrane domain of the IL-2 Rα receptor (•) were allowed to adhere to VN-coated wells in the presence of the indicated concentrations of uPA and the cell adhesion was quantified. (b) Similarly, the cells were allowed to adhere on VN- or FN-coated slide and immunostained with anti-uPAR (rabbit polyclonal) IgG followed by FITC-coupled anti-mouse IgG. Confocal microscopy was performed as described above. The top, middle, and bottom sections from adherent cells on VN and FN are shown in the figure. Bar = 10 μ m.
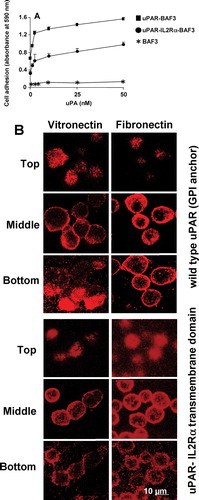
Figure 8 uPAR partitioning into lipid raft and non-raft domains in uPAR-BAF3 cells adherent on a VN or FN substrate. Cells adherent on a VN substrate (▵) or FN substrate (▴) were lysed and fractionated by sucrose density gradient centrifugation. Equal volumes were probed for (a) uPAR and (b) GM1 glycolipid by Western blotting and dot blotting respectively. The blots were scanned and the relative density for uPAR and GM1 was measured for each fraction. The fractions were numbered from bottom to the top with fractions 1–6 representing non-rafts and fractions 8–10 representing lipid rafts.
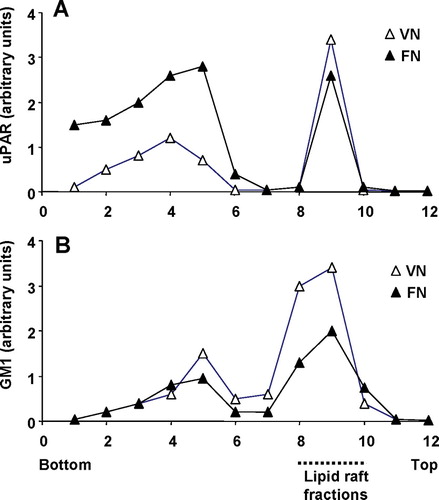
Figure 9 Characteristics of the adhesion of uPAR-BAF3 cells on VN and FN. Cells were allowed to adhere on (a) VN (2μ g/mL) or (b) FN (10 μ g/mL) in the presence of control IgG (20 μ g/mL), the anti-uPAR mAb 3936, R3 or R4 (each at 20 μ g/mL), anti-VLA4/ α4β1 integrin mAb PS/2 at 20 μ g/mL), anti-β2 integrin mAb Game 46 (15 μ g/mL), or EDTA (10 mM). In (a) experiments were performed in the absence (dotted bars) or presence (hatched bars) of 50-nM uPA and in (b) in the absence (dotted bars) or presence (hatched bars) of 50-ng/mL PMA. (c) Adhesion of cells on VN, FN, VN 1–44 (RGD–), VN 1–48 (RGD+) and BSA was performed as described above. Cell adhesion is expressed as absorbance at 590 nm (mean ± SEM, n = 3).