Figures & data
Figure 1 Schematic of the structure of double-layered, collagen gel hemispheres.
Figure 2 Distributions of cells after seven days of culture in DL-CGH. (a) and (d) Inverted microscope images of the bottoms of the gel hemispheres before drying (magnification 5.0×). (b) and (e) After drying, gels were captured in 800 pixel × 600 pixel JPEG files with a 1.5× magnification lens. (c) and (f) The outline of red staining was traced (with a blue line) and number of pixels within this perimeter was counted. The area of the inner layer (4.5 × 104 pixels, yellow circle) was subtracted to calculate area of expansion into the outer layer. While (c) PC-3 cells expanded into 94,957 pixels in the outer layer, (f) A549 invaded an area of only 5,273 pixels.
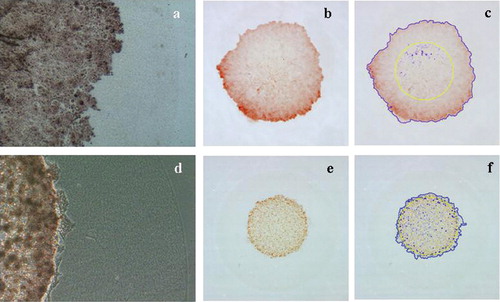
Figure 3 Treatment with an MMP inhibitor (MMPi). Cells treated withN-[(2R)-2-(hydroxamidocarbonylmethyl)-4-methyl pentanoyl]- l-tryptophan methylamide (0.005–5.0 μ M) showed a dose-dependent reduction in PC-3 cell invasion (from 16.9% less staining in 5-nM MMPi, relative to the control, to 92.7% less staining in 5-μ M MMPi), whereas control-treated cells showed no suppression of invasion.
![Figure 3 Treatment with an MMP inhibitor (MMPi). Cells treated withN-[(2R)-2-(hydroxamidocarbonylmethyl)-4-methyl pentanoyl]- l-tryptophan methylamide (0.005–5.0 μ M) showed a dose-dependent reduction in PC-3 cell invasion (from 16.9% less staining in 5-nM MMPi, relative to the control, to 92.7% less staining in 5-μ M MMPi), whereas control-treated cells showed no suppression of invasion.](/cms/asset/bb336508-5fb8-45ca-b74a-6e0f7675deb5/icac_a_255643_uf0003_b.gif)
Figure 4 Effect of down-regulation of cell adhesion molecules on the invasion activity of cancer cells. Cells transfected with inhibitory RNAs for 24 hours were embedded in the inner layer of DL-CGH and incubated for four days. Invasive activity was quantified by measuring increases in the area of red staining. (A) The cells were treated with (a) and (b) non-silencing siRNA, (c) and (d) siRNA against CD44, (e) and (f) siRNA against E-cadherin. (b), (d), and (f) The fringed outer border of red stain was marked using digital imaging software (blue line), then the area of inner layer (4.5 × 104 pixels, yellow circle) was subtracted to calculate the expanded area in outer layer. The numbers of pixels in each area were counted. (B) The histogram depicts the mean and standard deviation of numbers of red-stained pixels of outer layer in six samples for each condition. The pixel numbers of staining area expanded into outer layer were 13,625 +/– 2,826 in control, 13,113 +/– 3,186 in CD44-RNAi, and 26,593 +/− 4,076 in E-cadherin-RNAi. There were significant differences between non-silencing and E-cadherin RNAi, as well as between CD44-RNAi and E-cadherin-RNAi (p < 0.0001 by Student's t-test).
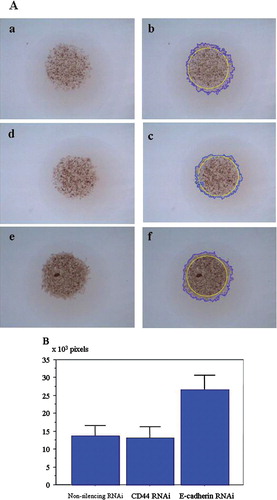
Figure 5 (a) and (b) Mixed cultures of A549 and WI-38, with WI-38 spreading widely into the outer layer of the collagen gel, and cancer cells following the fibroblast tracks. (c) and (d) A549 and WI-38 cells embedded separately in the inner and outer layers, respectively. Cancer cells only dispersed to the outer layer along fibroblast networks. (a) and (c) Images of the bottoms of gel hemispheres, captured by inversion microscopy before drying (5.0× magnification). (b) and (d) 1.5× magnified images after the drops had dried, when cell infiltration into the outer layer was assessed.
Figure 6 Images of a DL-CGH that included 0.75 × 10⁴ A549 cells (20% expressing GFP-β ctin) in the inner layer and 0.75 × 10⁴ WI-38 cells in the outer layer. Neutral and fluorescent images were captured separately and then merged. In 12 hours, labeled cells (marked with arrows) moved approximately 50 μ m along the surface of fibroblasts. (a) Image of cells after 80 hours of culture. (b) A second image of the same cells after 92 hours of culture. In time-lapse movies, the A549 cells appear to slip along the surfaces of fibroblasts.